Fig. 1.
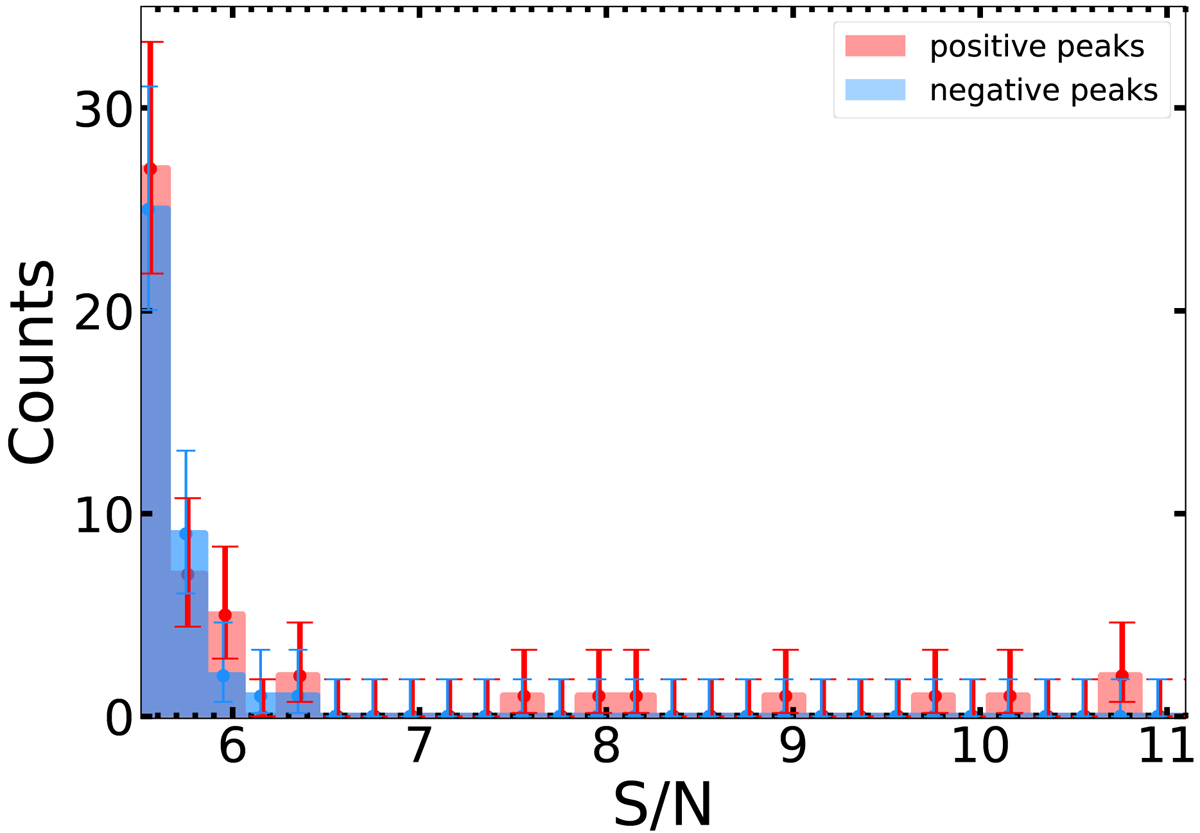
Number of positive (red) and negative (i.e., noise; blue) peaks detected in the 118 ALPINE pointings as a function of the S/N. The errorbars are the Poissonian uncertanties. We can see that for S/N > 5.8 the number of positive peaks becomes higher than the number of the negative ones as the number of genuine detections with regard to spurious sources increases.
Current usage metrics show cumulative count of Article Views (full-text article views including HTML views, PDF and ePub downloads, according to the available data) and Abstracts Views on Vision4Press platform.
Data correspond to usage on the plateform after 2015. The current usage metrics is available 48-96 hours after online publication and is updated daily on week days.
Initial download of the metrics may take a while.