Fig. B.1.
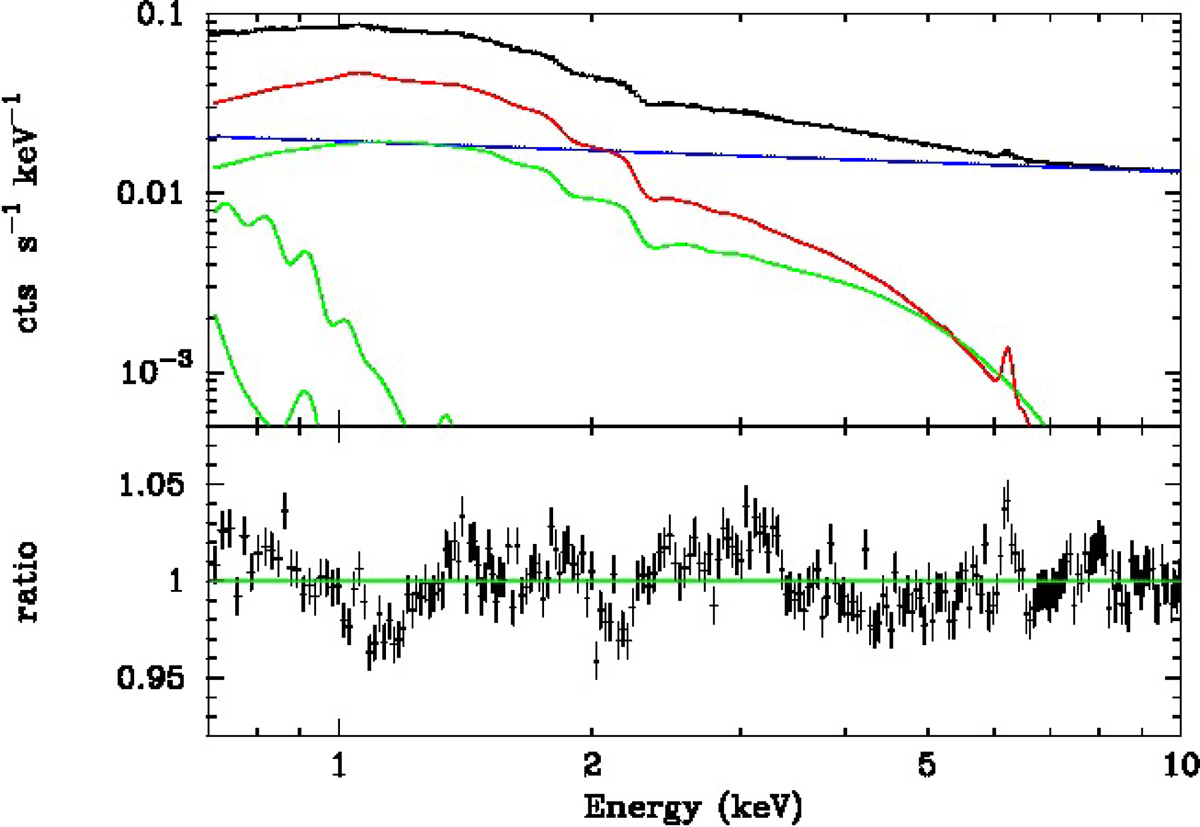
Top panel: simulated data and best fit model when making use of the full spectral range. The source is shown in red, the sky fore- and background in green, and the instrumental background in blue. Bottom panel: residuals in the form of a data over model ratio. All residual are below 5%, and are due to differences in the effective area and fore- and background parameters used in the simulation with respect to those adopted for the fit. We note how the low abundance value forced by the data around the Fe L-shell results in residuals around the Fe Kα line.
Current usage metrics show cumulative count of Article Views (full-text article views including HTML views, PDF and ePub downloads, according to the available data) and Abstracts Views on Vision4Press platform.
Data correspond to usage on the plateform after 2015. The current usage metrics is available 48-96 hours after online publication and is updated daily on week days.
Initial download of the metrics may take a while.