Fig. 17.
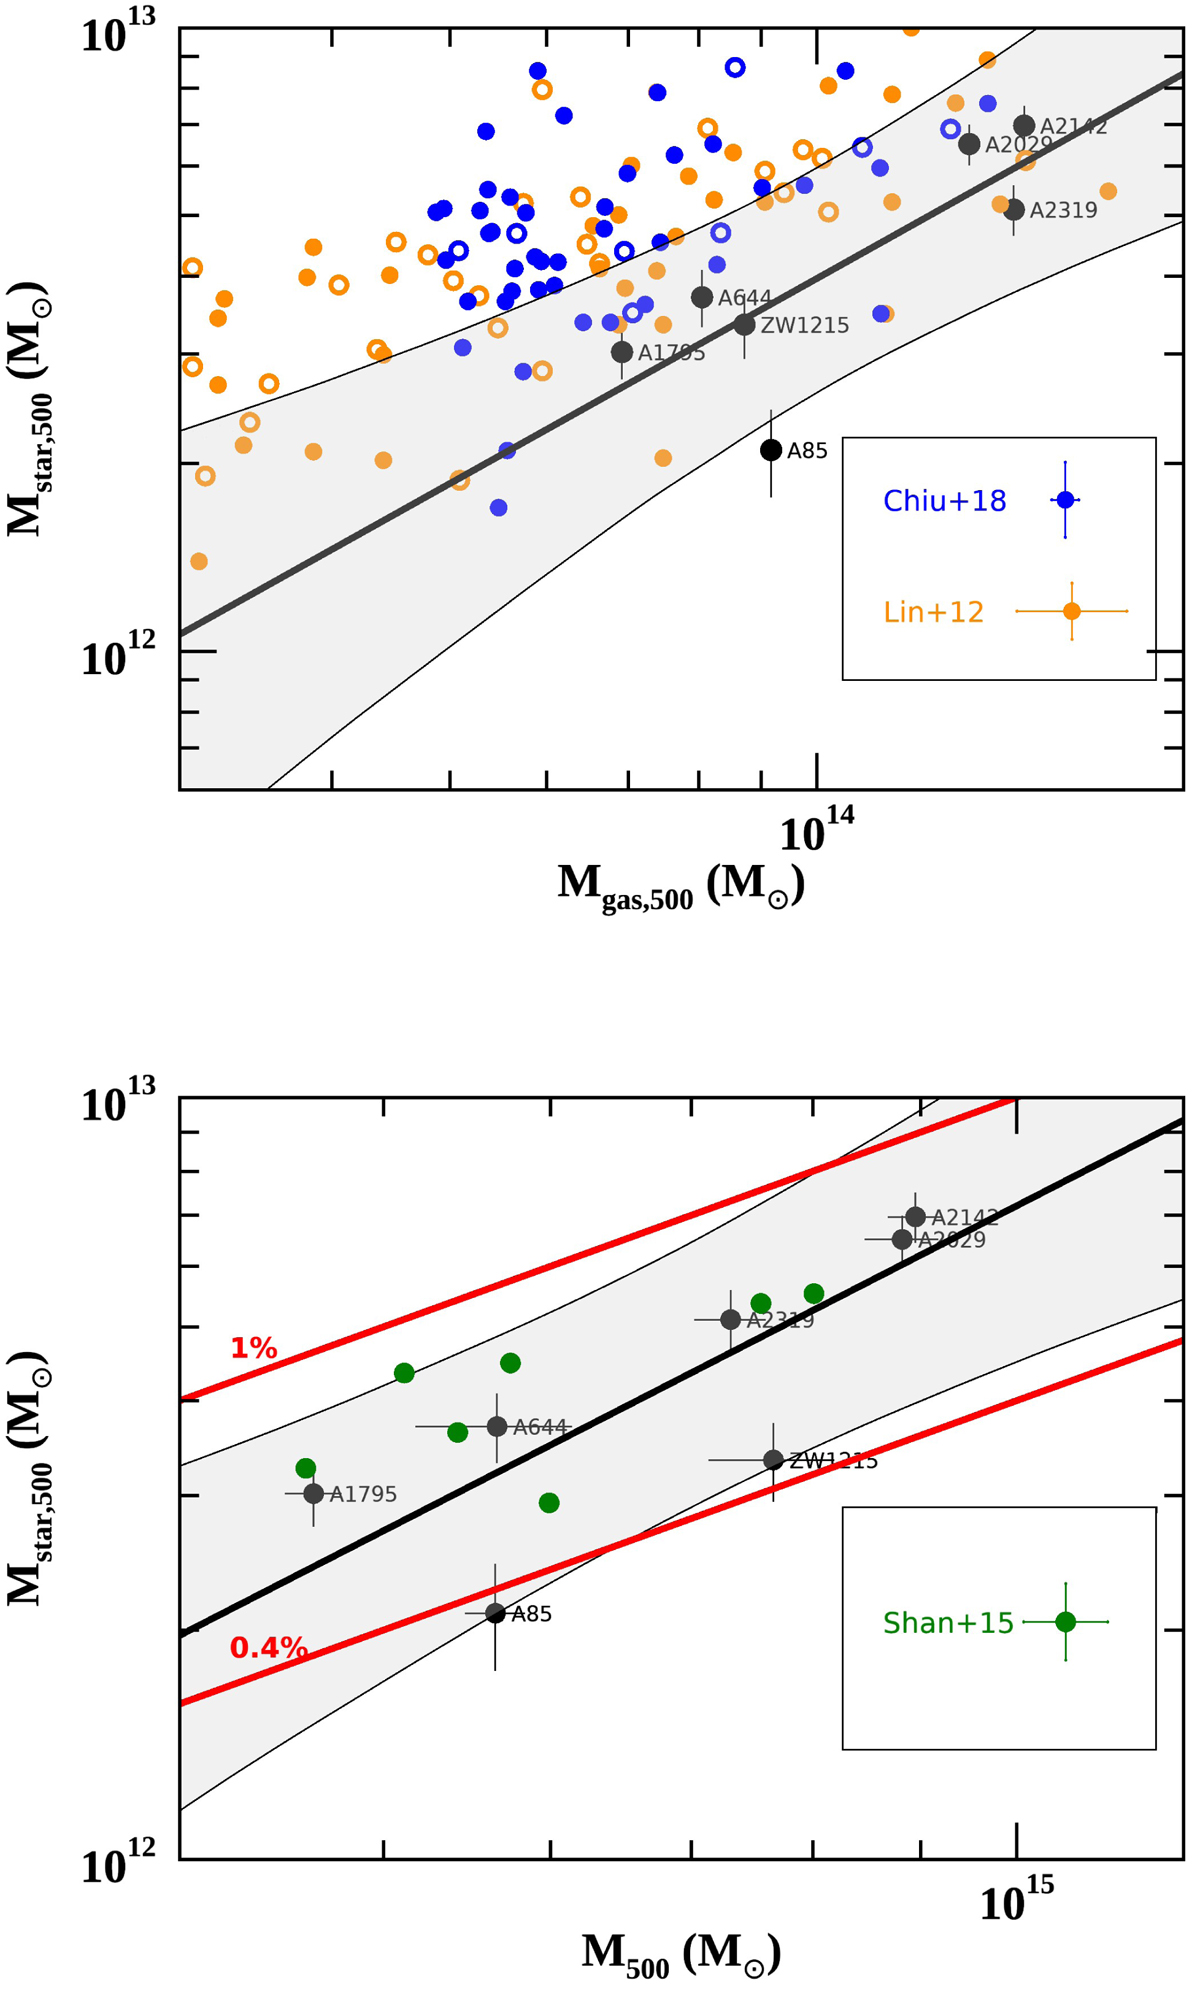
Stellar mass within R500 as a function of the gas mass (top panel) and total mass (bottom panel) within R500 for the X-COP sample (black circles). Black lines are the best fits and shaded areas indicate the 1σ confidence regions, including intrinsic scatters. Top panel: we plot for comparison data from Chiu et al. (2018) (blue circles) and Lin et al. (2012) (yellow circles) samples. Low redshift clusters of both samples are marked with open circles. Bottom panel: we report data by Shan et al. (2015) (green circles). We omit error bars for these samples to avoid overcrowding the plot: typical error bars are shown in the legend. Red lines in the bottom panel represent two fixed levels (0.4% and 1%) of stellar fraction.
Current usage metrics show cumulative count of Article Views (full-text article views including HTML views, PDF and ePub downloads, according to the available data) and Abstracts Views on Vision4Press platform.
Data correspond to usage on the plateform after 2015. The current usage metrics is available 48-96 hours after online publication and is updated daily on week days.
Initial download of the metrics may take a while.