Fig. 9.
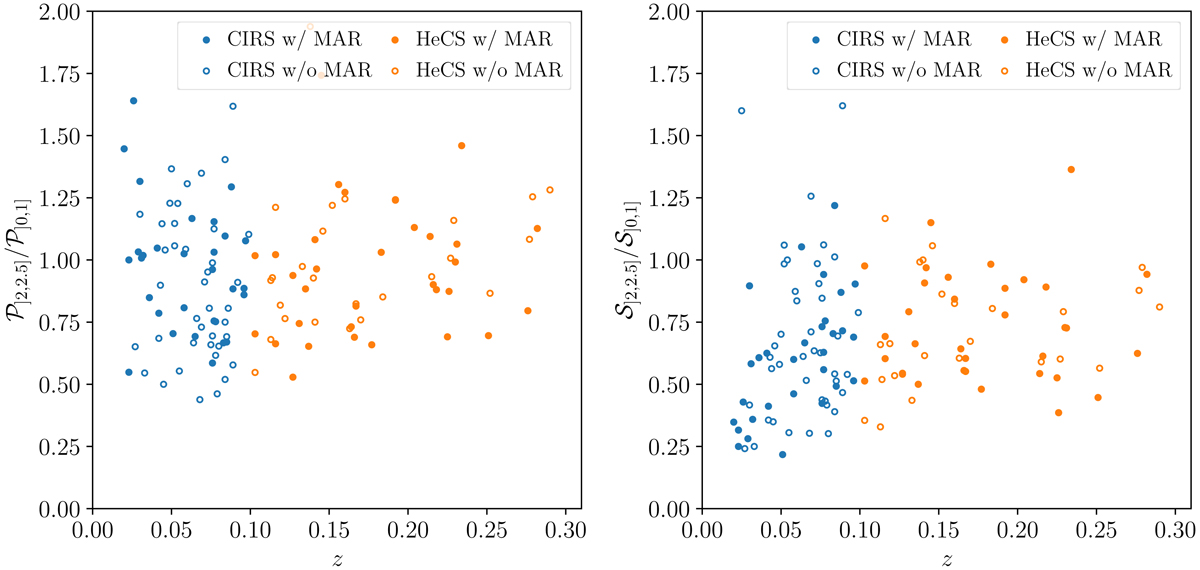
Left panel: ratio of the numbers of galaxies with photometric data in the range r/R200 ∈ ]2, 2.5] and within r/R200 = 1 within each cluster, against the cluster redshift. Right panel: ratio between the numbers of galaxies with spectroscopic redshifts within the same regions. Blue and orange points show the CIRS and HeCS clusters, respectively. Solid points show the clusters for which we estimate the individual MAR.
Current usage metrics show cumulative count of Article Views (full-text article views including HTML views, PDF and ePub downloads, according to the available data) and Abstracts Views on Vision4Press platform.
Data correspond to usage on the plateform after 2015. The current usage metrics is available 48-96 hours after online publication and is updated daily on week days.
Initial download of the metrics may take a while.