Fig. 8.
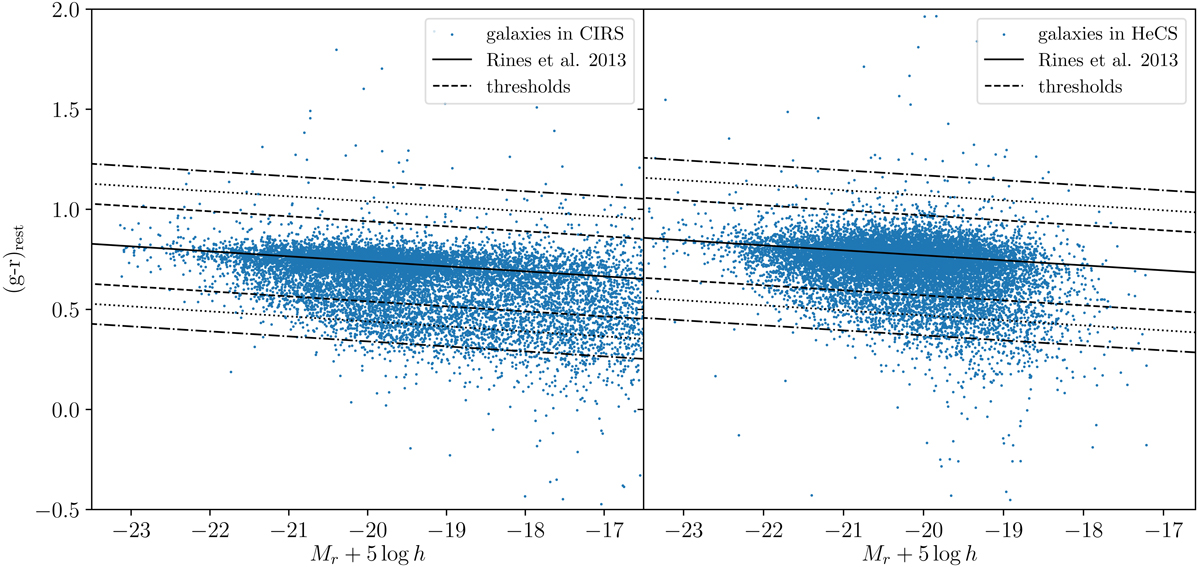
(g − r) colour-magnitude diagrams of the CIRS (left) and HeCS (right) galaxies, including k-corrections. The galaxies have a cluster-centric distance smaller than 3R200 and line-of-sight velocity |vlos − vcl|< 3000 km s−1. The black solid curve in the right panel shows the fit by Rines et al. (2013) derived from the HeCS galaxies. The black dashed, dotted, and dash-dotted lines show the ±0.30, ±0.40, ±0.50 shifts of the same fit. In the left panel, the black solid line shows the Rines et al.’s fit with an offset of −0.03 mag. The black dashed, dotted, and dash-dotted lines show the ±0.30, ±0.40, ±0.50 mag shifts of this line.
Current usage metrics show cumulative count of Article Views (full-text article views including HTML views, PDF and ePub downloads, according to the available data) and Abstracts Views on Vision4Press platform.
Data correspond to usage on the plateform after 2015. The current usage metrics is available 48-96 hours after online publication and is updated daily on week days.
Initial download of the metrics may take a while.