Fig. 5.
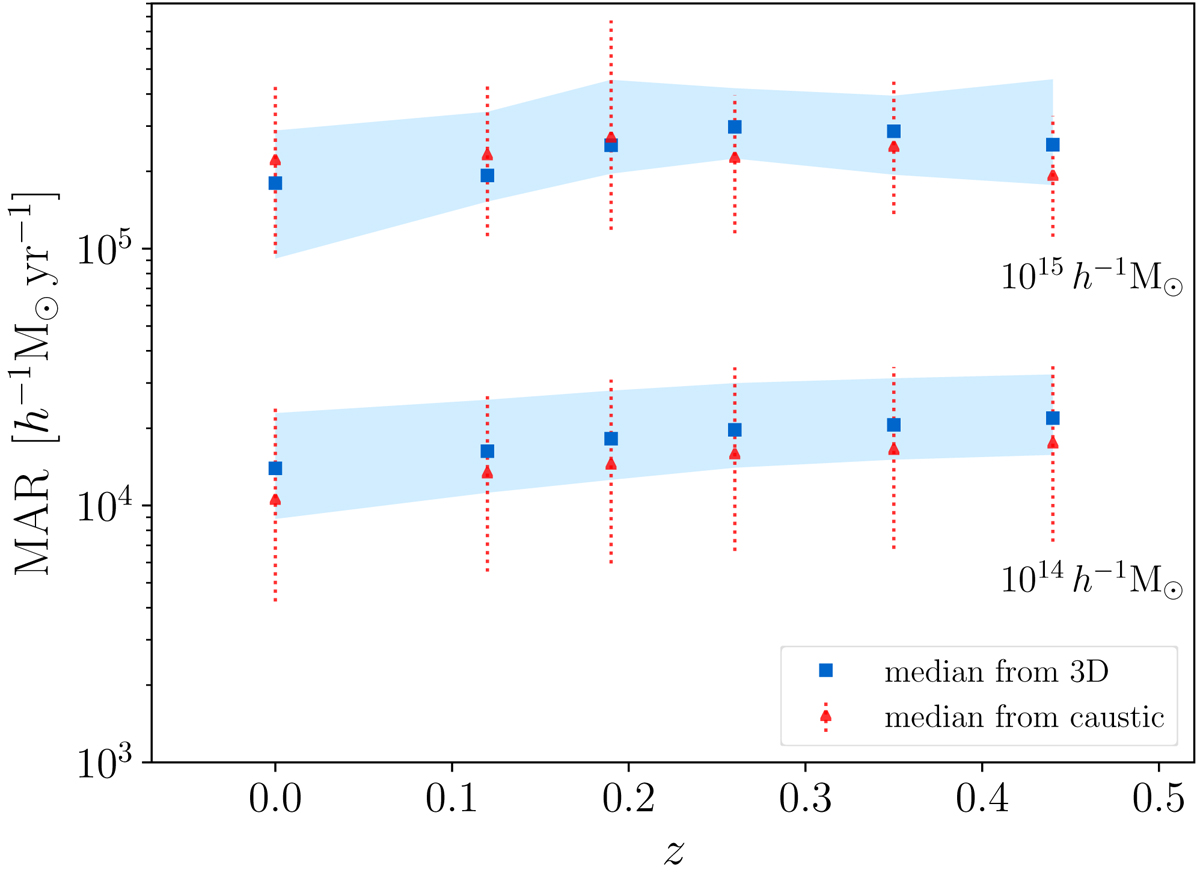
MAR of simulated clusters in the low- (lower set of points) and high- (upper set of points) mass bins. The blue squares and the red triangles show the median MAR based on the three-dimensional and the caustic mass profiles, respectively. The blue shaded areas show the 68th percentile range of the distribution of the MAR derived from the three-dimensional mass profiles; the red error bars show the 68th percentile ranges of the estimates obtained with the caustic mass profiles.
Current usage metrics show cumulative count of Article Views (full-text article views including HTML views, PDF and ePub downloads, according to the available data) and Abstracts Views on Vision4Press platform.
Data correspond to usage on the plateform after 2015. The current usage metrics is available 48-96 hours after online publication and is updated daily on week days.
Initial download of the metrics may take a while.