Fig. 2.
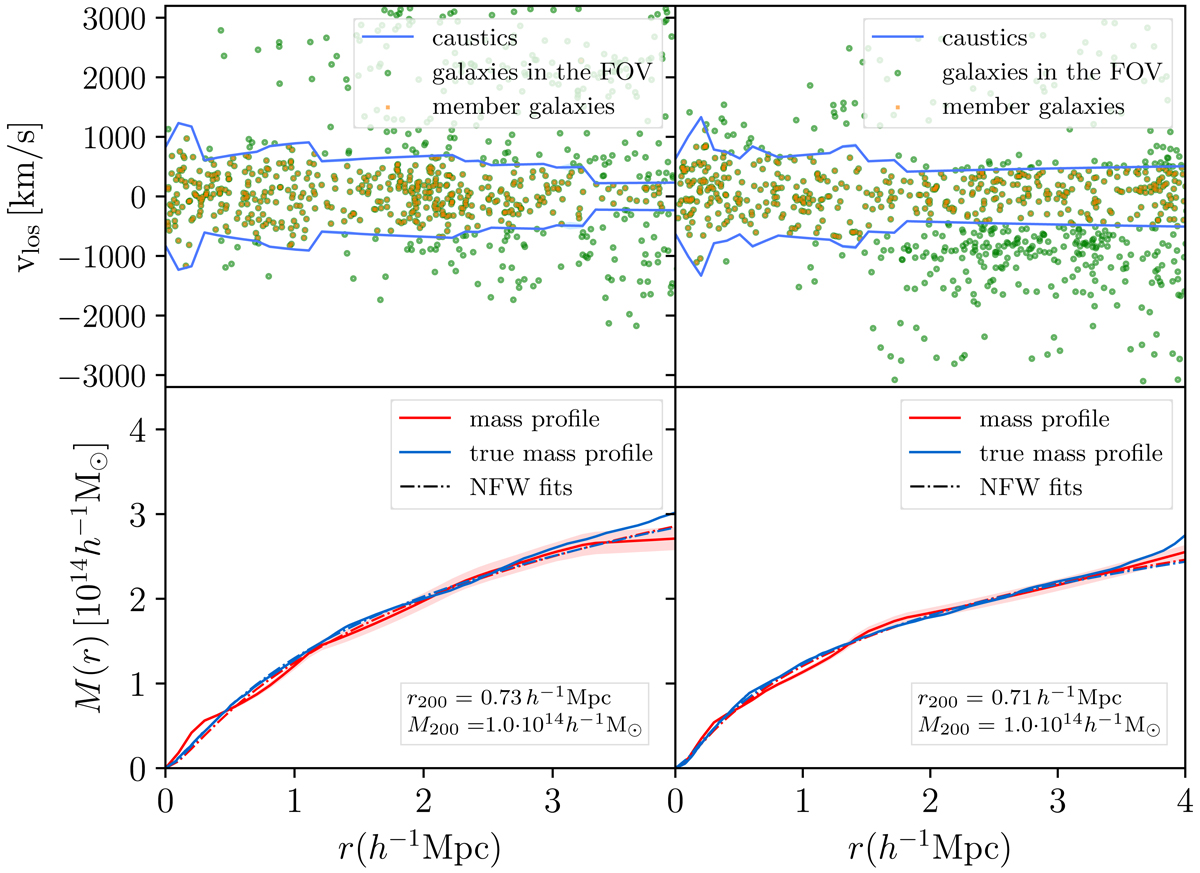
R − vlos diagram (top panels) and mass profile (bottom panels) of two simulated clusters in the low-mass bin. Left (right) column: cluster at z = 0.12 (z = 0.19). In the bottom panels, the red (blue) solid curves show the caustic (real) mass profile, whereas the red (blue) dot-dashed curves show the NFW fits to the caustic (real) mass profile. In these two examples, the two NFW fits are indistinguishable. The shaded areas show the 50% confidence level of the caustic location and of the caustic mass profile according to the caustic technique recipe. In the R − vlos diagrams the shaded areas are present, but very thin.
Current usage metrics show cumulative count of Article Views (full-text article views including HTML views, PDF and ePub downloads, according to the available data) and Abstracts Views on Vision4Press platform.
Data correspond to usage on the plateform after 2015. The current usage metrics is available 48-96 hours after online publication and is updated daily on week days.
Initial download of the metrics may take a while.