Fig. 19.
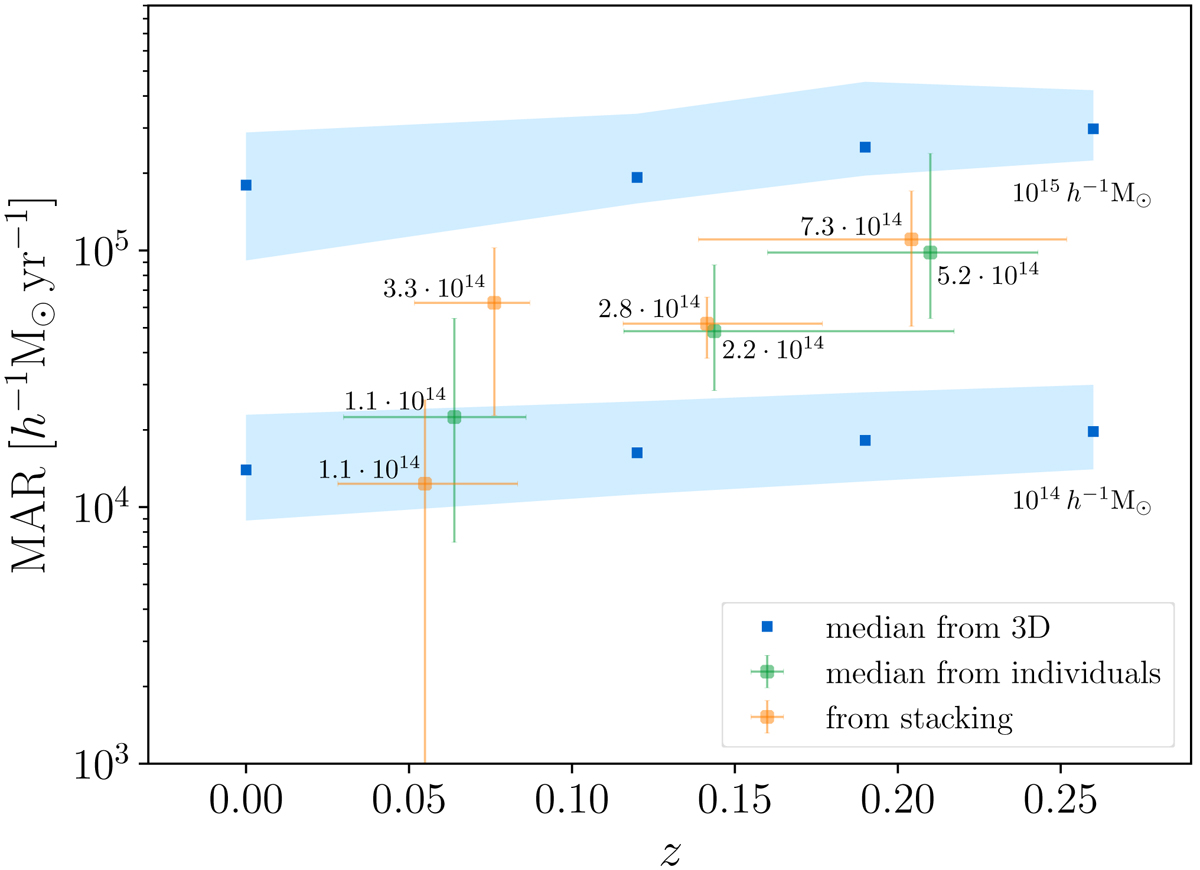
MARs of the stacked clusters of CIRS (the two orange circles at low redshift) and HeCS (the two orange circles at high redshift). The median MARs of the individual clusters from Fig. 15 are shown in green. The value close to each circle is the mass M200 in units of h−1 M⊙. The blue squares with the shaded bands are from Fig. 5 and show the median MARs and their spreads of the simulated clusters estimated with the three-dimensional mass profiles.
Current usage metrics show cumulative count of Article Views (full-text article views including HTML views, PDF and ePub downloads, according to the available data) and Abstracts Views on Vision4Press platform.
Data correspond to usage on the plateform after 2015. The current usage metrics is available 48-96 hours after online publication and is updated daily on week days.
Initial download of the metrics may take a while.