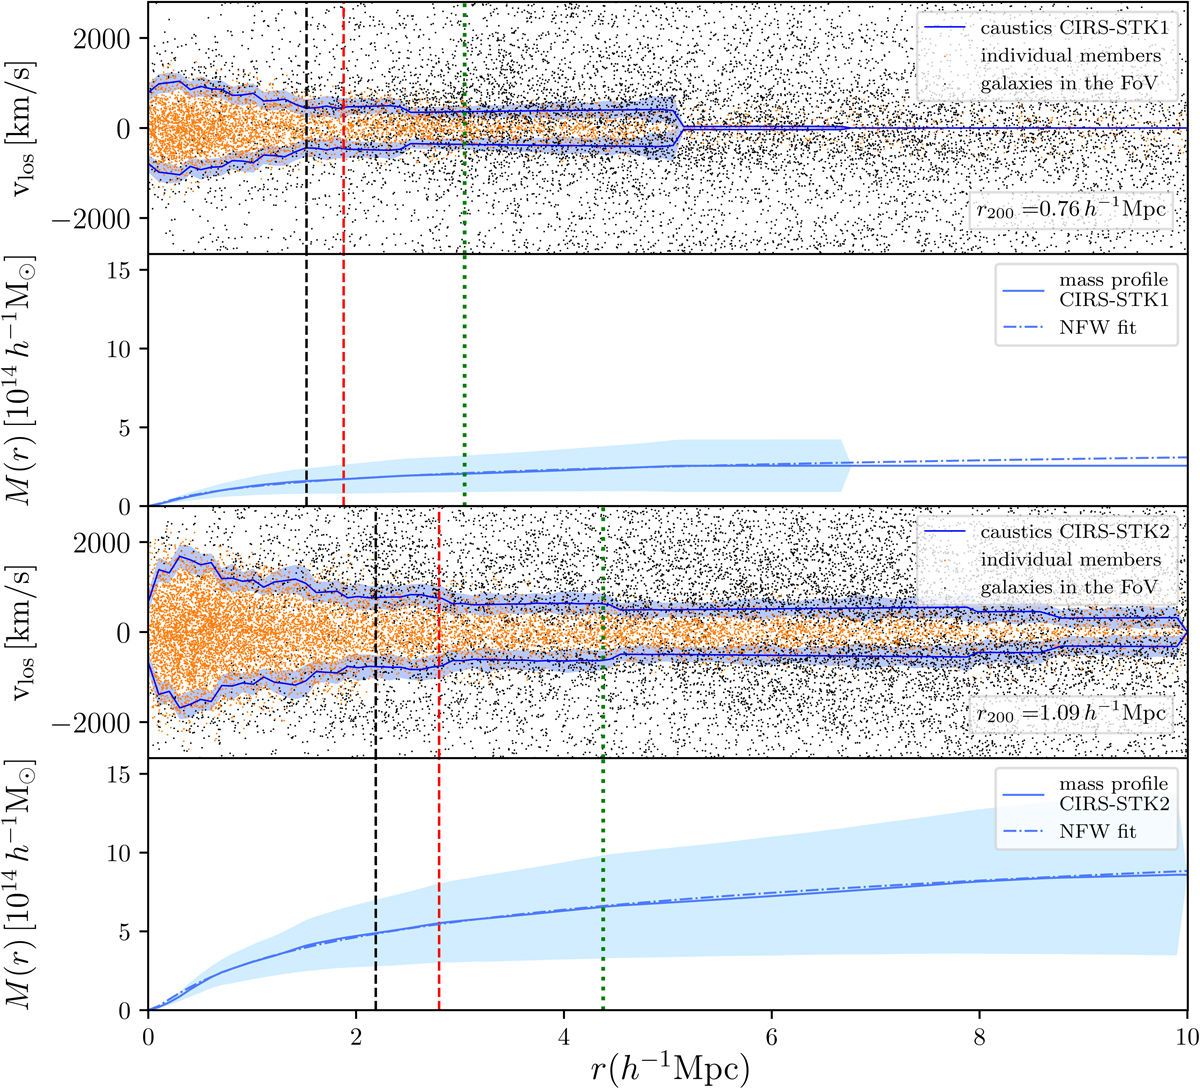
Fig. 17.
R − vlos diagrams and corresponding mass profiles of the two stacked clusters from the CIRS catalogue. The upper (lower) panels refer to the low-mass (high-mass) subsample. The black and red dashed vertical lines show the inner and outer radius of the spherical shell used to estimate the MAR. The shaded areas show the 50% confidence level of the caustic location and of the caustic mass profile according to the caustic technique recipe. The dot-dashed lines show the NFW fits to the caustic mass profiles; the green vertical dotted lines show the upper limit of the radial range over which the NFW fits have been performed.
Current usage metrics show cumulative count of Article Views (full-text article views including HTML views, PDF and ePub downloads, according to the available data) and Abstracts Views on Vision4Press platform.
Data correspond to usage on the plateform after 2015. The current usage metrics is available 48-96 hours after online publication and is updated daily on week days.
Initial download of the metrics may take a while.