Fig. 16.
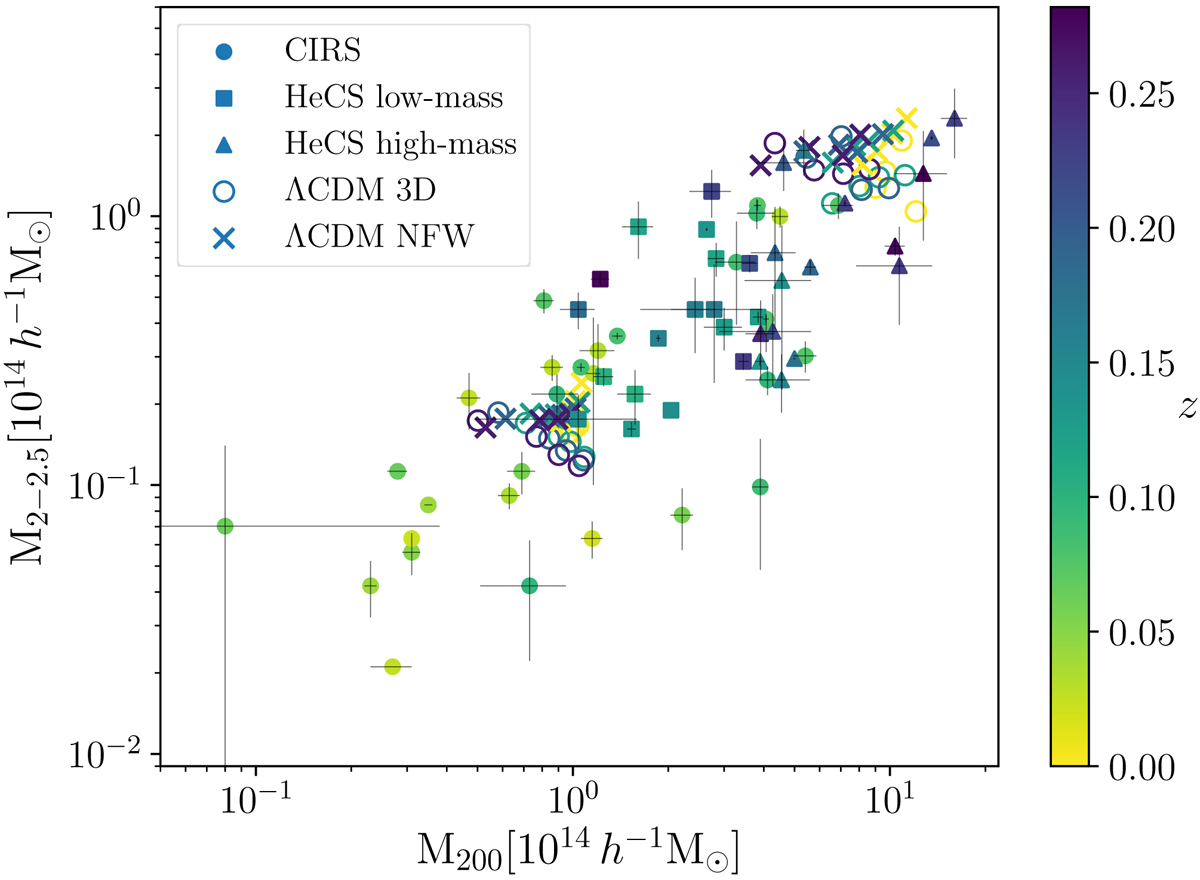
Mass M2−2.5 of the shell with radii 2R200 and 2.5R200 as a function of M200. The colour code shows the dependence on redshift. Circles, squares and triangles refer to the CIRS, low- and high-mass HeCS sample, respectively. The open circles show the median M2−2.5 of the N-body clusters of our two simulated samples, estimated from their three-dimensional mass profiles. The crosses show the median M2−2.5 obtained from the NFW fits to the three-dimensional mass profiles: on average, they overestimate the individual true mass of the shell by ∼22−28%, depending on the mass bin.
Current usage metrics show cumulative count of Article Views (full-text article views including HTML views, PDF and ePub downloads, according to the available data) and Abstracts Views on Vision4Press platform.
Data correspond to usage on the plateform after 2015. The current usage metrics is available 48-96 hours after online publication and is updated daily on week days.
Initial download of the metrics may take a while.