Fig. 15.
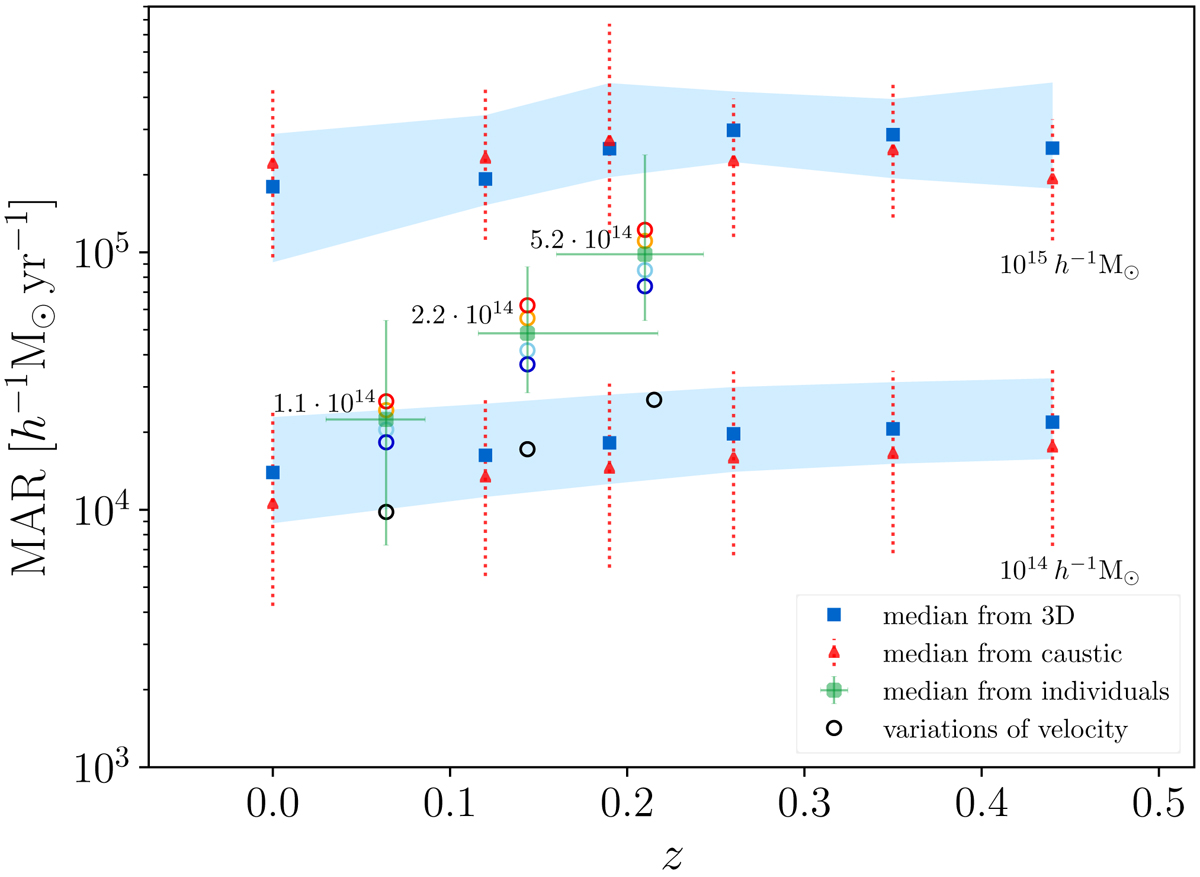
Median MARs of real (green) and simulated (blue and red) clusters. The green error bars show the 68th percentile ranges of the MAR and redshift distributions of the real clusters. The value close to each green filled circle is the median mass M200 of the real clusters in units of h−1 M⊙. The blue squares and red triangles are for the MAR based on the three-dimensional and the caustic mass profiles of simulated clusters, respectively (from Fig. 5). The light-blue shaded areas and the red error bars are the 68th percentile range of the distribution of the individual MAR of the simulated clusters. The open circles show the median MARs of real clusters for different values of the infall velocity. We show the results where we changed the initial infall velocity that we adopted by: −40% (blue), −20% (cyan), +20% (orange), and then +40% (red). The black circles show the MAR estimated with an initial infall velocity of vi = 0.
Current usage metrics show cumulative count of Article Views (full-text article views including HTML views, PDF and ePub downloads, according to the available data) and Abstracts Views on Vision4Press platform.
Data correspond to usage on the plateform after 2015. The current usage metrics is available 48-96 hours after online publication and is updated daily on week days.
Initial download of the metrics may take a while.