Fig. 12.
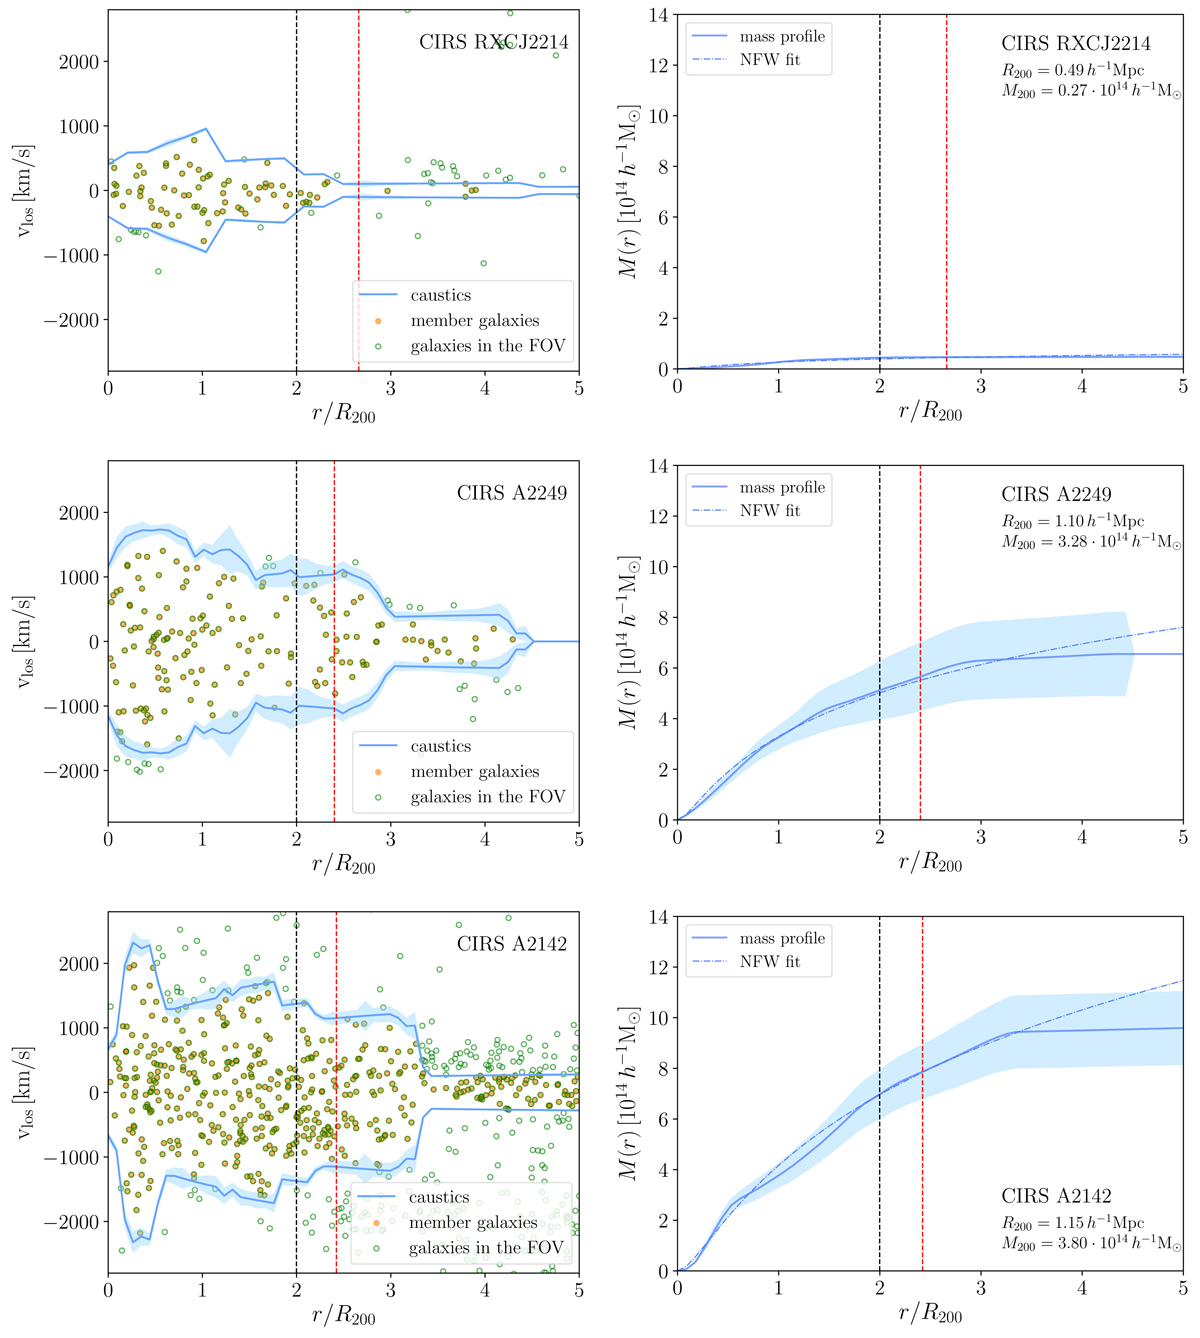
Three examples of the estimation of the MAR for individual clusters in CIRS. The left column shows the R − vlos diagram for each cluster. The right column shows the corresponding caustic mass profile (solid line) and the NFW fit (dot-dashed line). The black and red dashed lines show the inner and outer radius of the infalling spherical shell. The M200 of the clusters increases from top to bottom.
Current usage metrics show cumulative count of Article Views (full-text article views including HTML views, PDF and ePub downloads, according to the available data) and Abstracts Views on Vision4Press platform.
Data correspond to usage on the plateform after 2015. The current usage metrics is available 48-96 hours after online publication and is updated daily on week days.
Initial download of the metrics may take a while.