Free Access
Fig. 10.
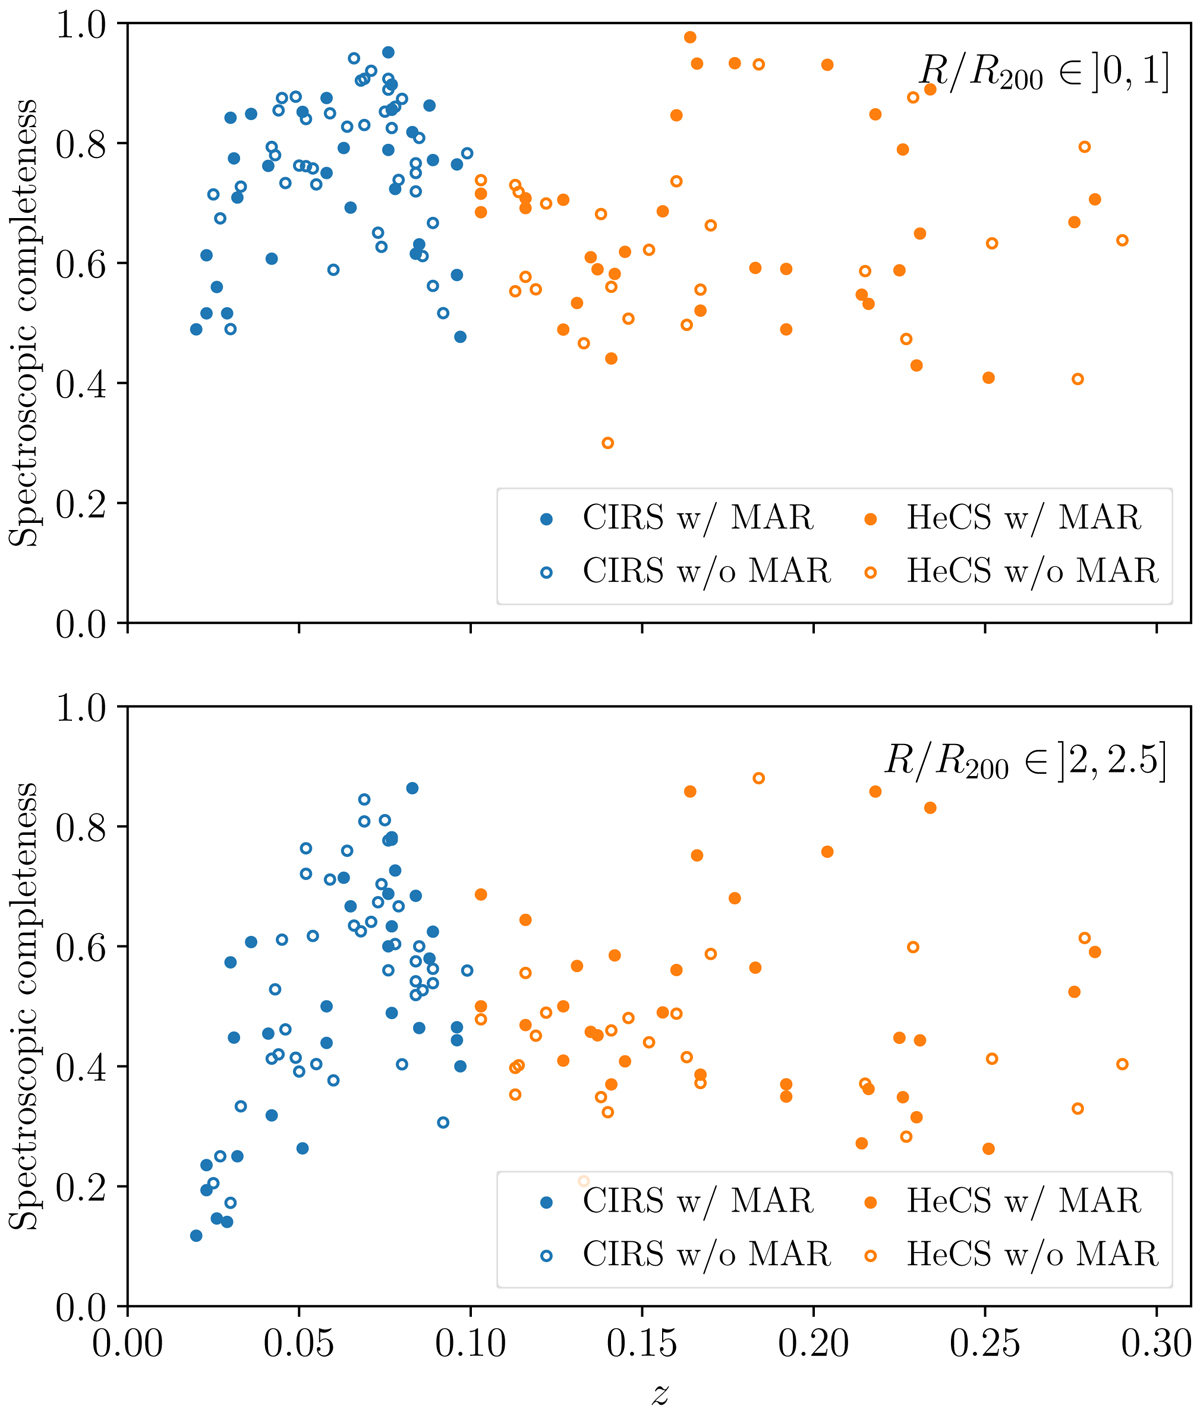
Spectroscopic completeness of the CIRS (blue points) and HeCS (orange points) clusters, against their redshifts, within r/R200 = 1 from the cluster centre (upper panel) and within the range r/R200 ∈ ]2, 2.5] (lower panel). Solid points show the clusters for which we estimate the individual MAR.
Current usage metrics show cumulative count of Article Views (full-text article views including HTML views, PDF and ePub downloads, according to the available data) and Abstracts Views on Vision4Press platform.
Data correspond to usage on the plateform after 2015. The current usage metrics is available 48-96 hours after online publication and is updated daily on week days.
Initial download of the metrics may take a while.