Fig. 1.
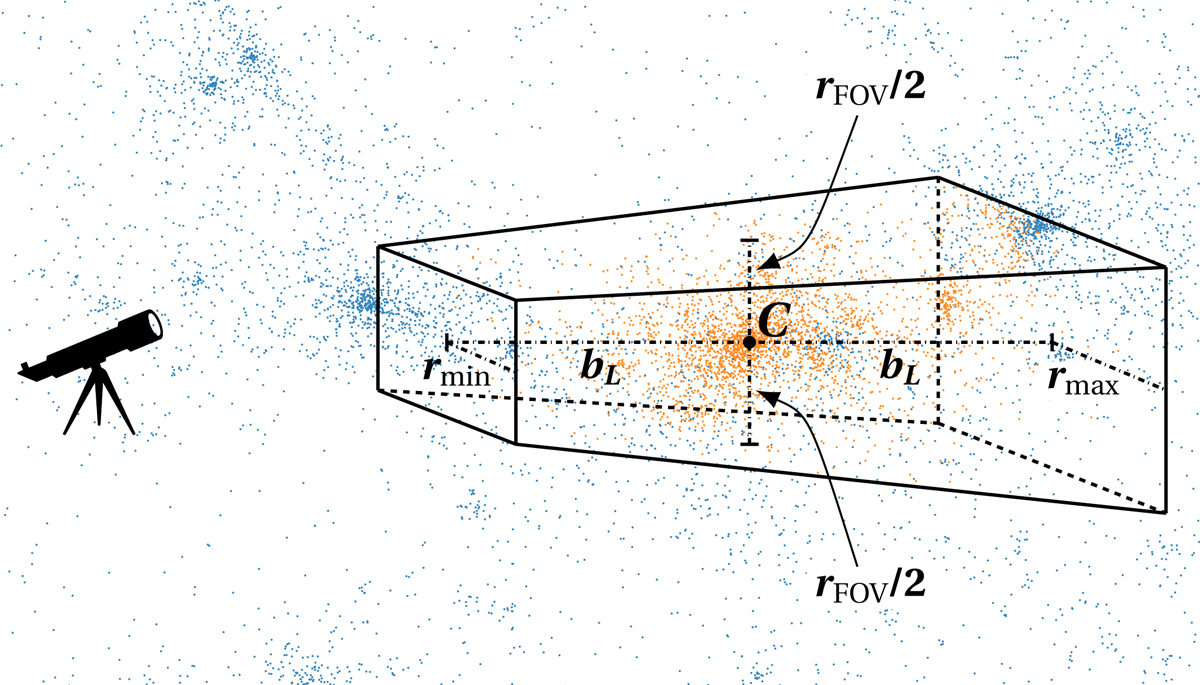
Schematic figure of the truncated-pyramidal volume of the mock catalogue of a cluster extracted from the simulation. The solid dots show the positions of the dark matter particles in a slice of the simulation box centred on the cluster C. The orange (blue) dots are within (outside) the volume. This figure has only an illustrative purpose: the actual mock catalogues have bL ≫ rFOV and include a substantially larger number of particles than shown here.
Current usage metrics show cumulative count of Article Views (full-text article views including HTML views, PDF and ePub downloads, according to the available data) and Abstracts Views on Vision4Press platform.
Data correspond to usage on the plateform after 2015. The current usage metrics is available 48-96 hours after online publication and is updated daily on week days.
Initial download of the metrics may take a while.