Free Access
Fig. 3.
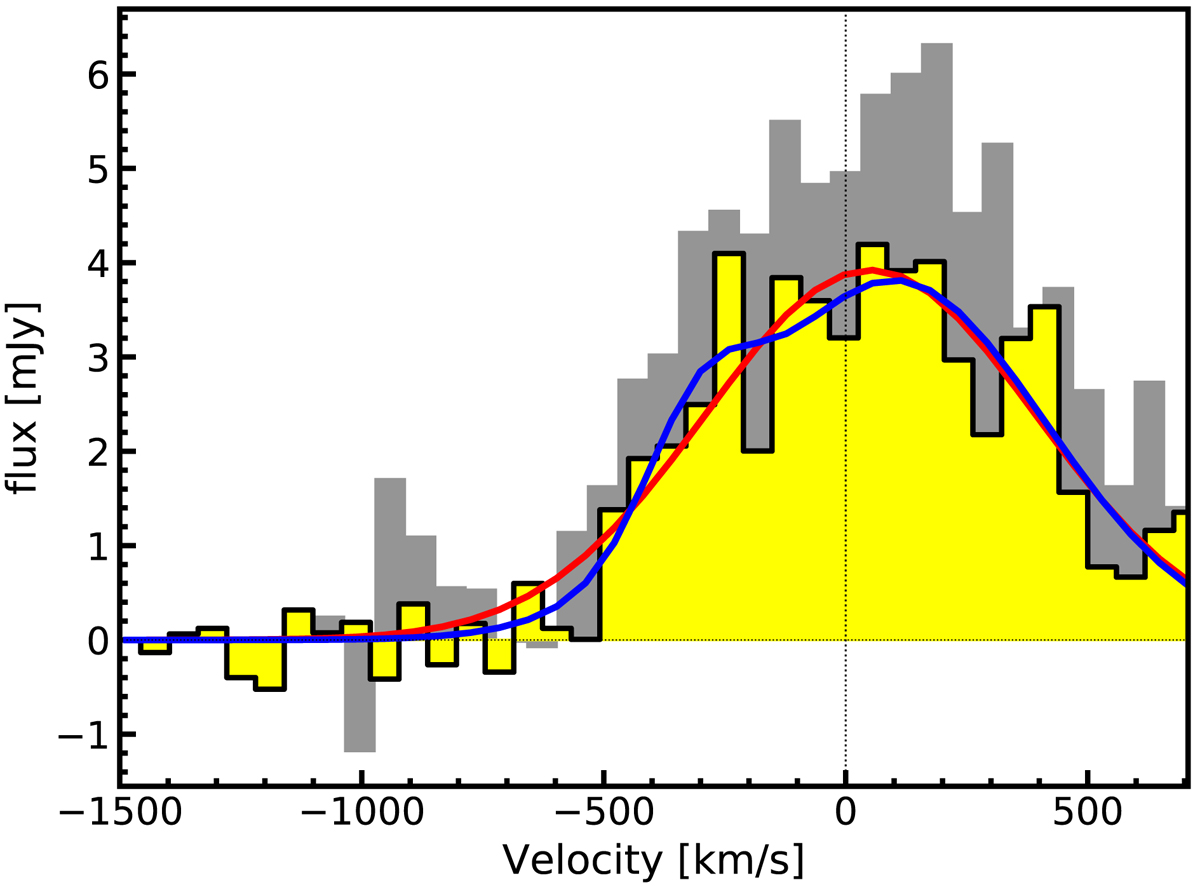
Detected H2O line (yellow) of W0410−0913, with the CO(9−8) emission (grey) shown in the background for comparison. The fitted single and double Gaussians are shown with the red and blue curves, respectively.
Current usage metrics show cumulative count of Article Views (full-text article views including HTML views, PDF and ePub downloads, according to the available data) and Abstracts Views on Vision4Press platform.
Data correspond to usage on the plateform after 2015. The current usage metrics is available 48-96 hours after online publication and is updated daily on week days.
Initial download of the metrics may take a while.