Fig. 6.
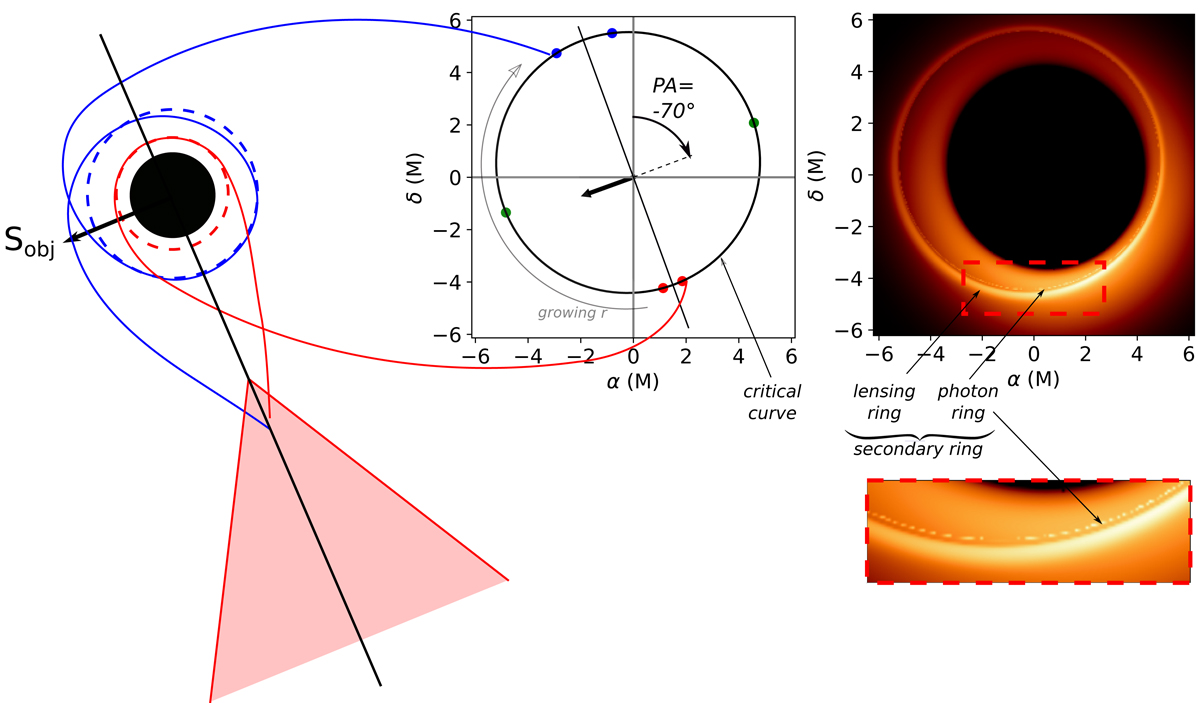
Left sketch: black hole surroundings. The black hole event horizon is represented by a black disk, and the geometrically thick accretion disk is represented by the shaded red region (only one half of the disk is shown to save space). The sketch is rotated to have the same orientation of the black hole spin vector (black arrow) as in the central panel. The dashed red and blue circles around the black hole are the location of two Kerr spherical photon orbits (not to scale), the radii of which are given below. Central panel: plot of the critical curve on the observer’s sky as defined by the polar Eq. (3), for a black hole spin of a = 0.8M and an inclination angle of i = 160°. The critical curve is rotated to account for the position angle of M87* (PA = −70° as labeled on the panel, or 290° east of north). The projection of the black hole spin vector is shown by the black arrow (opposite to the approaching jet projection depicted by the blue arrow in Fig. 2). Three pairs of points are shown in red, green, and blue along the curve and are the images of the Kerr spherical orbits with radii r = 2.31M, 2.7M, and 3.05M, respectively. The Kerr equatorial prograde and retrograde photon orbits for a = 0.8M are rph, pro = 1.82M and rph, retro = 3.81M. The gray bent arrow at the left of the critical curve shows the direction of increase of the Kerr spherical orbit radius that the photon is following on its way to the observer (same evolution on the right side of the critical curve). Two null geodesics connecting the red and blue Kerr spherical orbits to the corresponding points on the critical curve are illustrated between the left drawing and the central panel. Right panel: ray-traced image of the model with the same field of view as in the middle panel. This image is a zoom on the central 45 μas of the top left panel of Fig. 3. The 4 important notions introduced in the text, lensing, photon, secondary rings, and critical curve, are labeled. The zoom on the region of the right panel surrounded by the dashed red rectangle is shown in the bottom right insert. This allows us to better see the difference between the lensing and photon rings. The critical curve is extremely close in angular radius to the photon ring (they are impossible to distinguish with the naked eye when comparing the central and right panels). However, the two notions are different mathematically. In the limit of an infinite resolution, the photon ring of the right panel would decompose into a sequence of rings converging to the critical curve.
Current usage metrics show cumulative count of Article Views (full-text article views including HTML views, PDF and ePub downloads, according to the available data) and Abstracts Views on Vision4Press platform.
Data correspond to usage on the plateform after 2015. The current usage metrics is available 48-96 hours after online publication and is updated daily on week days.
Initial download of the metrics may take a while.