Fig. A.1.
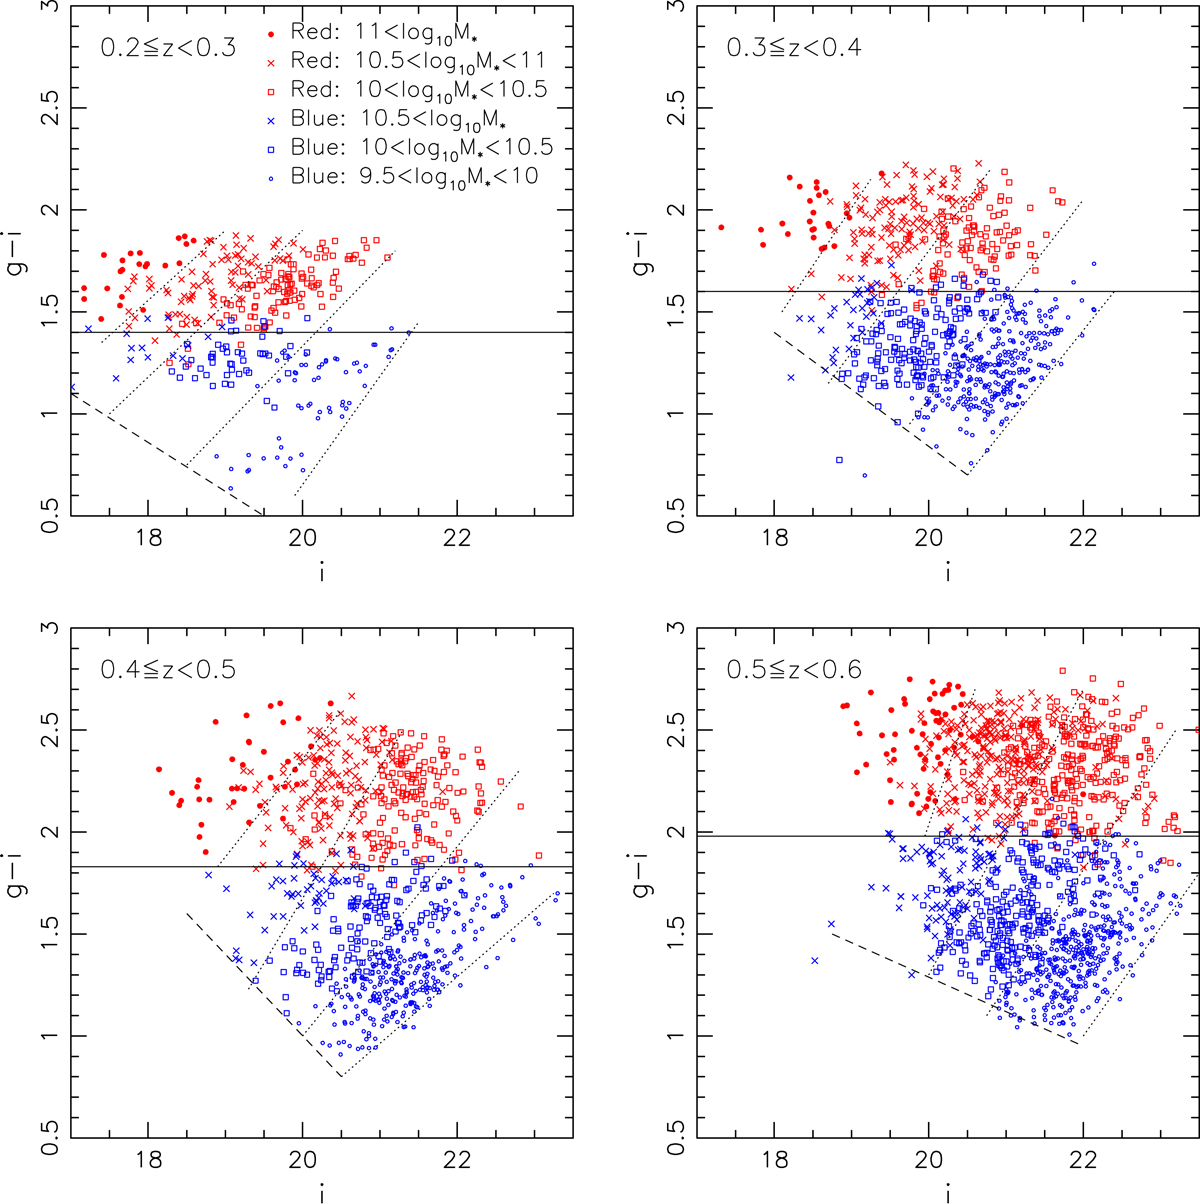
Distribution of red galaxies (TBPZ ≤ 1.5) versus blue galaxies (1.5 < TBPZ < 3.95) selected according to the photometric type from BPZ and split into different stellar mass bins in g − i versus i colour-magnitude space, as found in the CFHTLenS field W1m0m1. The solid and dotted lines illustrate how we split the lenses into red versus blue bins and approximate stellar mass bins, respectively, in the analysis of CS82 data. The dashed lines additionally indicate g − i limits used to exclude very blue star forming galaxies in the CS82 analysis.
Current usage metrics show cumulative count of Article Views (full-text article views including HTML views, PDF and ePub downloads, according to the available data) and Abstracts Views on Vision4Press platform.
Data correspond to usage on the plateform after 2015. The current usage metrics is available 48-96 hours after online publication and is updated daily on week days.
Initial download of the metrics may take a while.