Fig. 4.
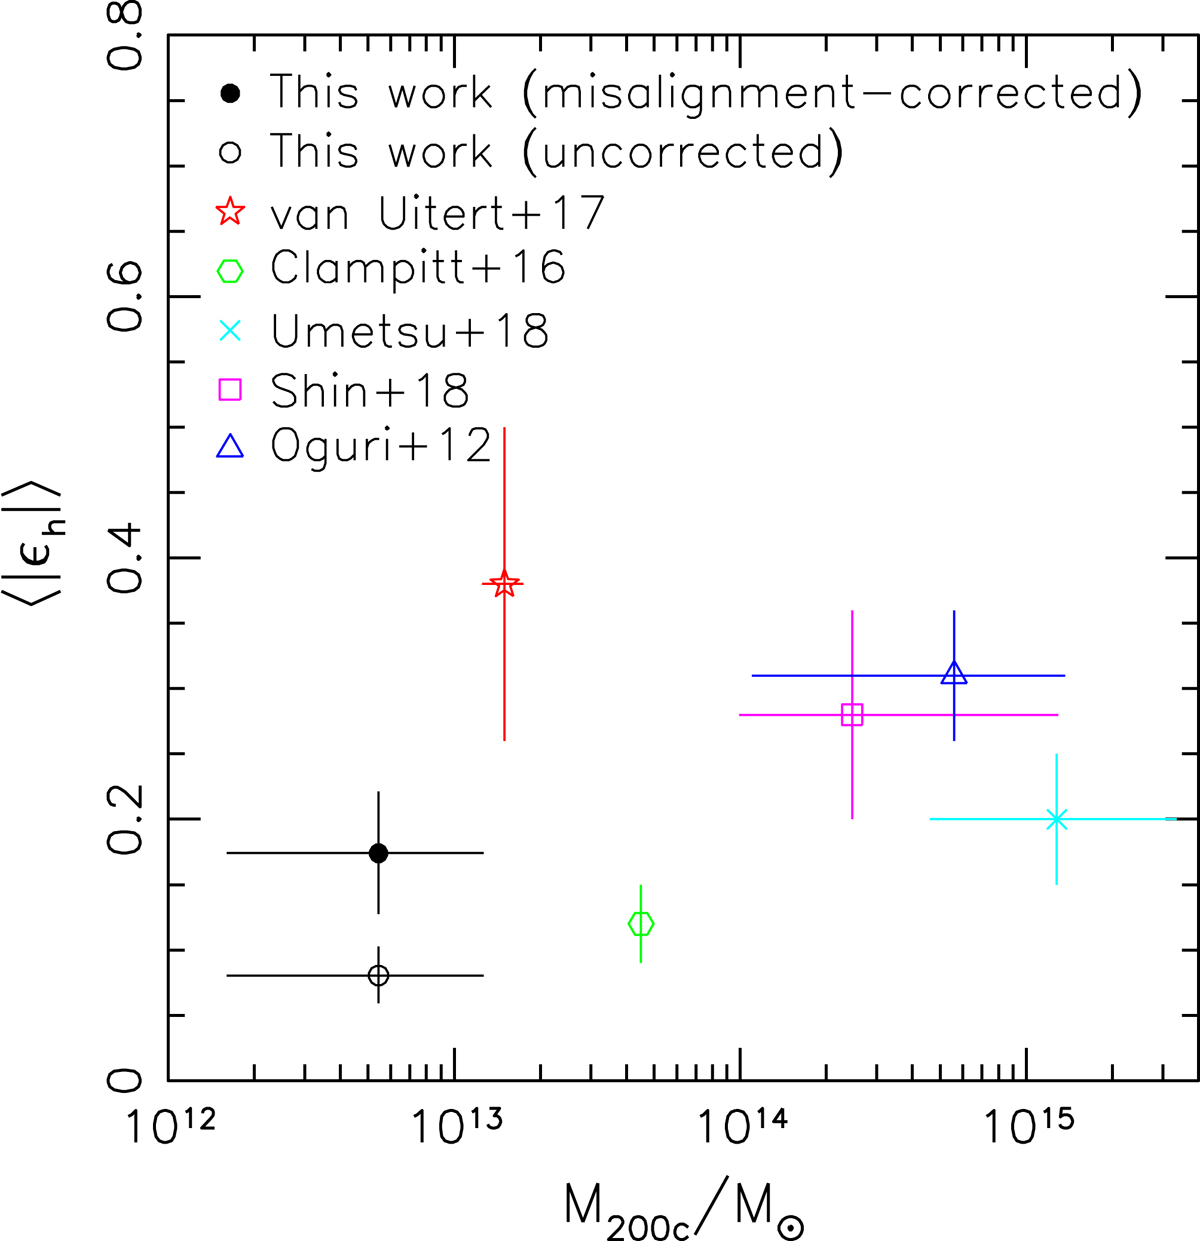
Comparison of constraints on ⟨|ϵh|⟩ for red galaxies, galaxy groups, and galaxy clusters from different studies. For our study we combine the constraints from all red lens samples for our two highest stellar mass bins, showing both the uncorrected estimate (assuming perfect alignment of galaxies and haloes), and the more realistic misalignment-corrected estimate. The latter assumes that the impact of misalignment is correctly described by the comparison of the results from the S15 Millennium Simulation analyses with and without misalignment (see Sect. 5). The horizontal error-bars indicate the approximate lens mass range for our results as well as the studies from Oguri et al. (2012), Shin et al. (2018) and Umetsu et al. (2018). For van Uitert et al. (2017) the data point is shown at their best-fit mean mass, where the error corresponds to the fit uncertainty. Clampitt & Jain (2016) only report an approximate mean mass for their sample. We apply mass conversions in case authors employ other definitions than M200c.
Current usage metrics show cumulative count of Article Views (full-text article views including HTML views, PDF and ePub downloads, according to the available data) and Abstracts Views on Vision4Press platform.
Data correspond to usage on the plateform after 2015. The current usage metrics is available 48-96 hours after online publication and is updated daily on week days.
Initial download of the metrics may take a while.