Fig. 3.
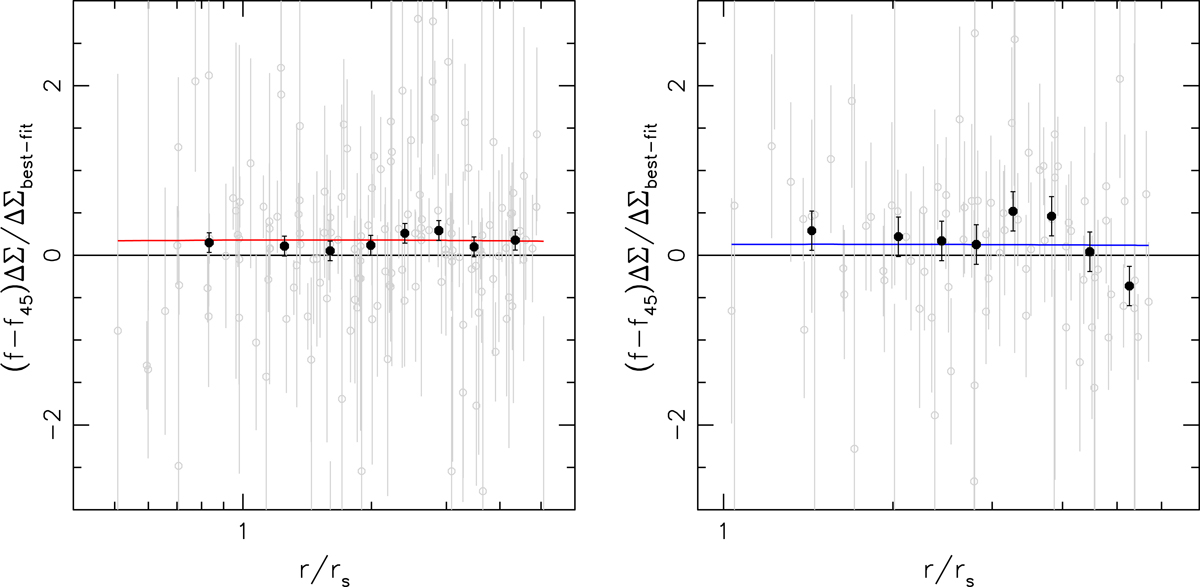
Ratio of the measured (f − f45)ΔΣ(r) profiles and the best-fit models for the spherical ΔΣ(r) profiles as a function of the radius in units of the NFW scale radius rs. Left panel: red lenses, while blue lenses are shown on the right. Each grey point corresponds to one data point from Figs. 1 and C.1–C.4 (if it is located within the included fit range, see Sect. 4). Binned averages of these points are shown in black. The curves show model predictions (frel − frel, 45)fh for the best-fit joint fh estimates for all red lenses (left) and all blue lenses (right).
Current usage metrics show cumulative count of Article Views (full-text article views including HTML views, PDF and ePub downloads, according to the available data) and Abstracts Views on Vision4Press platform.
Data correspond to usage on the plateform after 2015. The current usage metrics is available 48-96 hours after online publication and is updated daily on week days.
Initial download of the metrics may take a while.