Fig. 2.
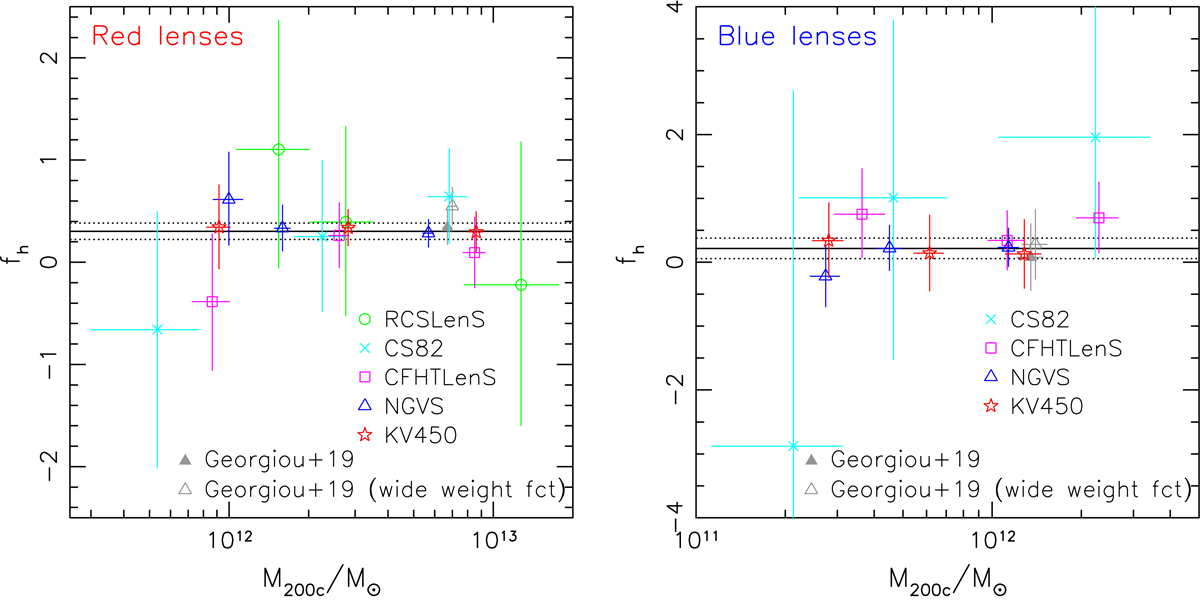
Constraints on fh and M200c from the different surveys for red (left) and blue (right) lenses. For each survey, the different data points correspond to the different stellar mass bins. The horizontal solid and dotted lines mark the best-fit joint fh constraints and the ±1σ limits, respectively. For comparison we also show results from the KiDS-1000 analysis of central galaxies from Georgiou et al. (2019b), including their default constraints and their results achieved using a wider weight function for the shape measurements (shown with an offset in mass for clarity).
Current usage metrics show cumulative count of Article Views (full-text article views including HTML views, PDF and ePub downloads, according to the available data) and Abstracts Views on Vision4Press platform.
Data correspond to usage on the plateform after 2015. The current usage metrics is available 48-96 hours after online publication and is updated daily on week days.
Initial download of the metrics may take a while.