Fig. 1.
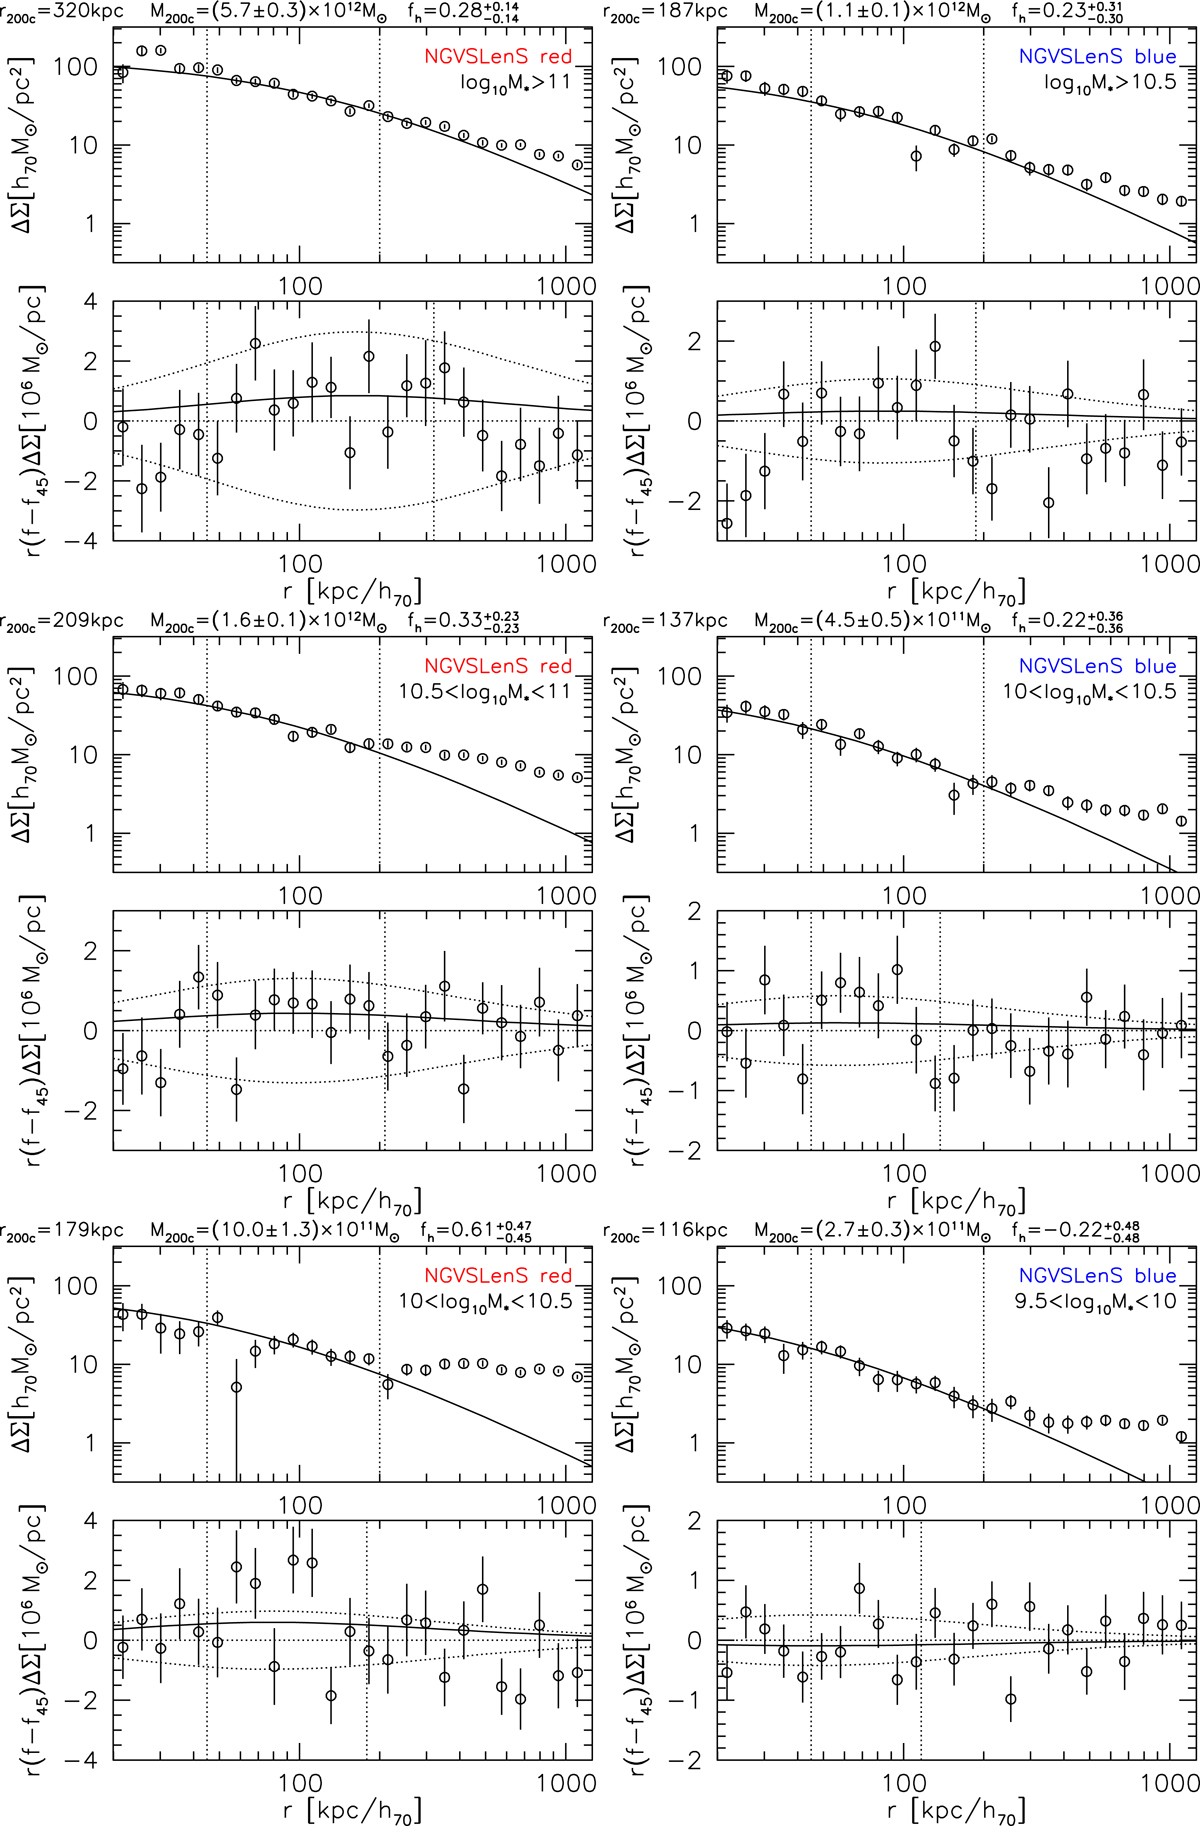
Measured isotropic (top sub-panel in each panel) and anisotropic (bottom sub-panel in each panel, note the varying y-axis scale) shear signal around red (left) and blue (right) lenses in the NGVSLenS fields. From top to bottom: decreasing stellar mass bins as indicated. For better readability the anisotropic signal has been scaled by r. The best-fitting NFW shear profile constrained within 45 kpc/h70 < r < 200 kpc/h70 is shown by the curve for the isotropic signal. For (f − f45)ΔΣ the curves show models computed from the best-fit isotropic model and the best-fit fh for the solid curve, and fh ∈ { + 1, 0, −1} for the dotted curves, respectively. The best-fit fh has been constrained from (f − f45)ΔΣ and ΔΣ within 45 kpc/h70 < r < r200c (range indicated by vertical lines), where r200c has been estimated from the isotropic signal. The corresponding figures for the other surveys are shown in Appendix C.
Current usage metrics show cumulative count of Article Views (full-text article views including HTML views, PDF and ePub downloads, according to the available data) and Abstracts Views on Vision4Press platform.
Data correspond to usage on the plateform after 2015. The current usage metrics is available 48-96 hours after online publication and is updated daily on week days.
Initial download of the metrics may take a while.