Free Access
Fig. 3.
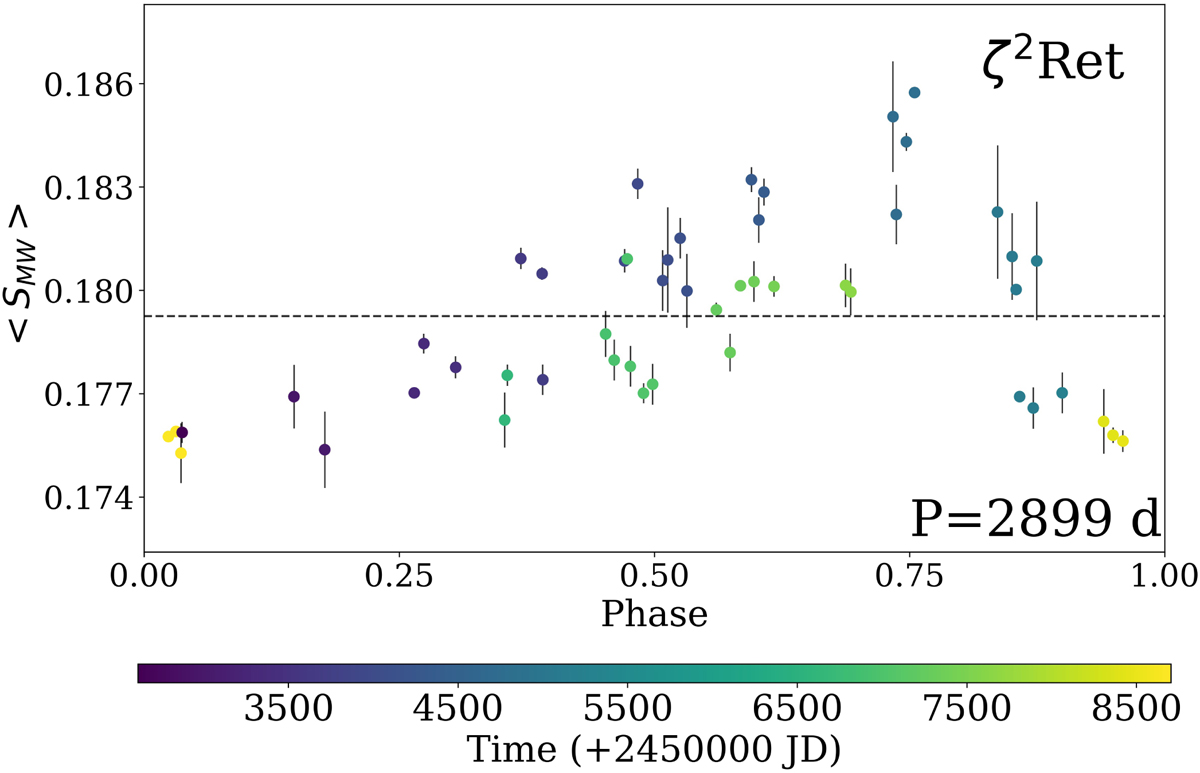
Monthly means of the Mount Wilson indexes for ζ2 Ret phased with a period of ∼7.9 yr. The observing seasons are represented by coloured circles. The error bars of HARPS data and the corresponding mean activity level (dashed horizontal line) have been included.
Current usage metrics show cumulative count of Article Views (full-text article views including HTML views, PDF and ePub downloads, according to the available data) and Abstracts Views on Vision4Press platform.
Data correspond to usage on the plateform after 2015. The current usage metrics is available 48-96 hours after online publication and is updated daily on week days.
Initial download of the metrics may take a while.