Free Access
Fig. 2.
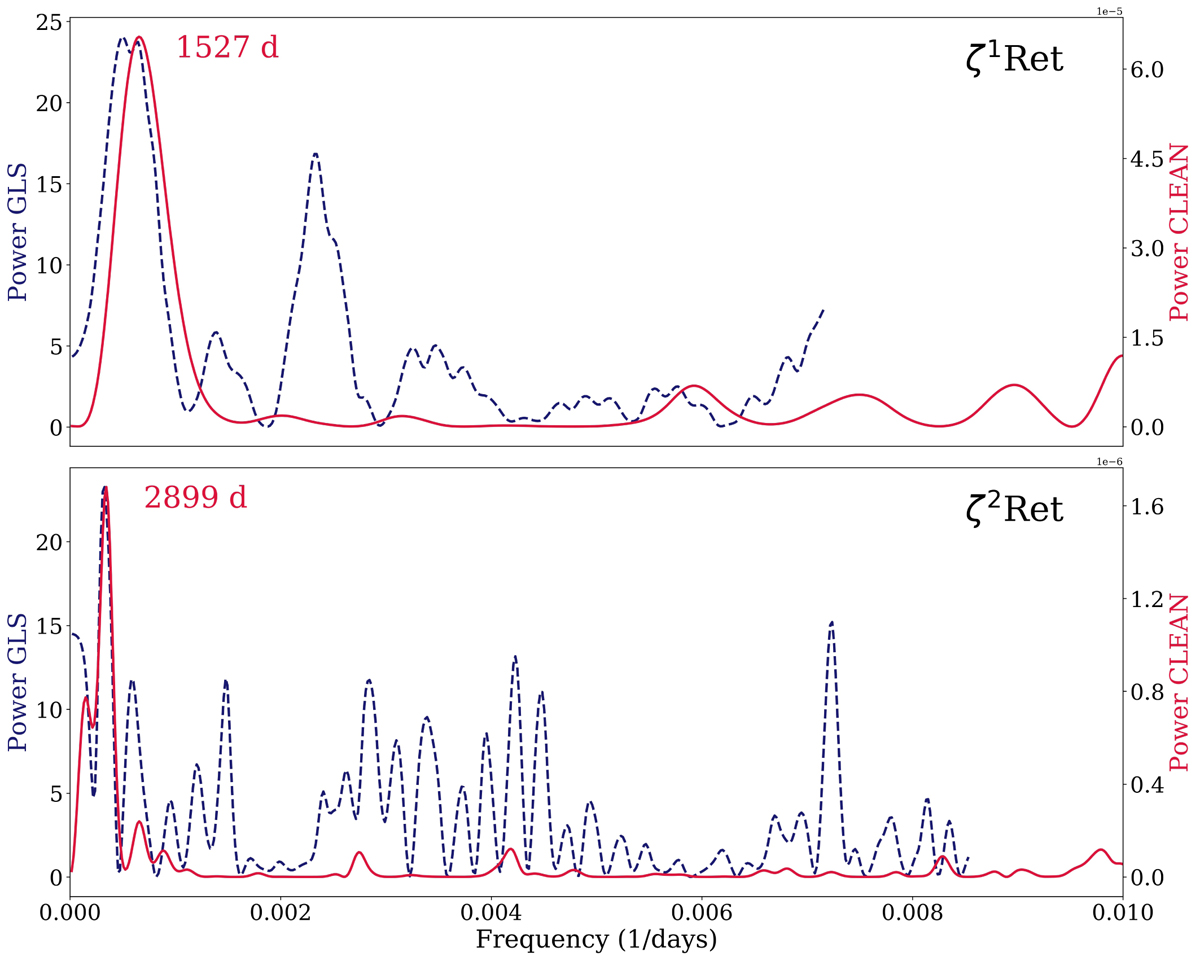
GLS (blue dashed line) and CLEAN (red continuous line) periodograms for the means of the Mount Wilson indexes plotted in Fig. 1. Upper and lower panels: correspond to ζ1 Ret and ζ2 Ret, respectively. The most significant CLEAN periods are indicated in each panel.
Current usage metrics show cumulative count of Article Views (full-text article views including HTML views, PDF and ePub downloads, according to the available data) and Abstracts Views on Vision4Press platform.
Data correspond to usage on the plateform after 2015. The current usage metrics is available 48-96 hours after online publication and is updated daily on week days.
Initial download of the metrics may take a while.