Fig. 1.
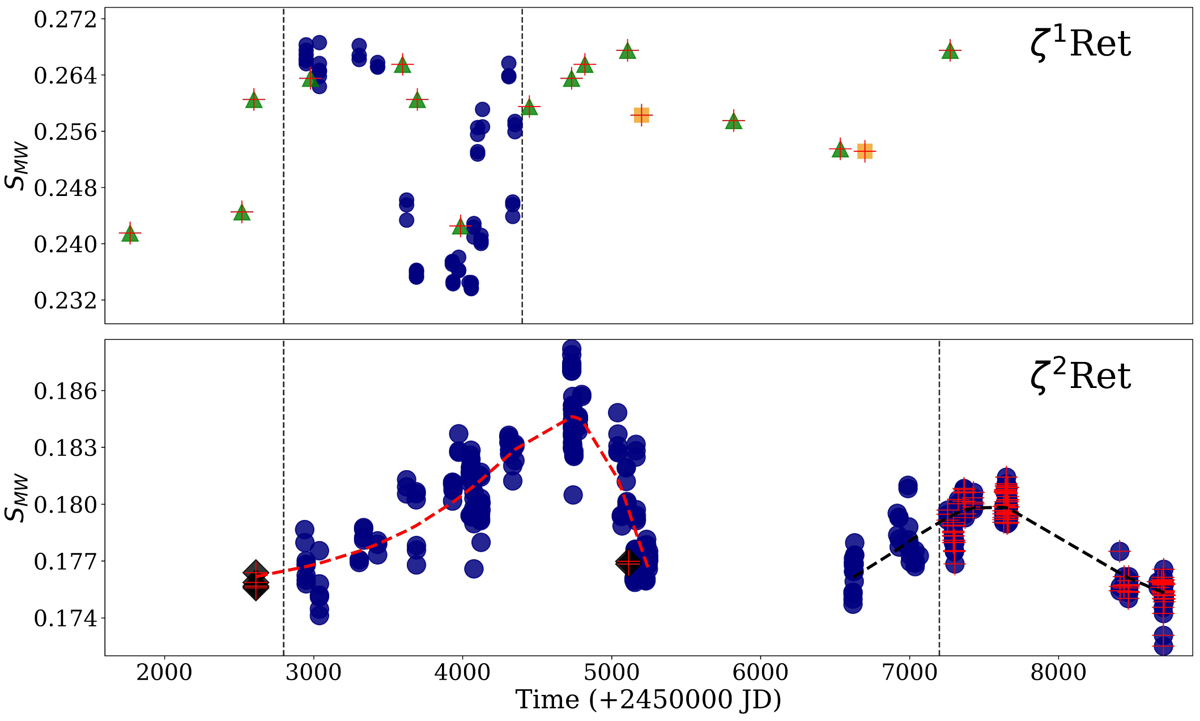
Upper panel: SMW index variation of ζ1 Ret. HARPS data are indicated with blue circles (for both panels), while REOSC and FEROS data are indicated with green triangles and orange squares, respectively. Lower panel: activity variation for ζ2 Ret. Here, UVES data are indicated with black diamonds. Both vertical dashed lines in each panel represent the time coverage of those series that were initially reported, while the new data are indicated with red crosses. Red and black dashed lines show the fitted activity maxima f(t) for both peaks.
Current usage metrics show cumulative count of Article Views (full-text article views including HTML views, PDF and ePub downloads, according to the available data) and Abstracts Views on Vision4Press platform.
Data correspond to usage on the plateform after 2015. The current usage metrics is available 48-96 hours after online publication and is updated daily on week days.
Initial download of the metrics may take a while.