| Issue |
A&A
Volume 645, January 2021
|
|
|---|---|---|
| Article Number | L3 | |
| Number of page(s) | 6 | |
| Section | Letters to the Editor | |
| DOI | https://doi.org/10.1051/0004-6361/202039814 | |
| Published online | 23 December 2020 | |
Letter to the Editor
A search for dust and molecular gas in enormous Lyα nebulae at z ≈ 2
1
INAF – Osservatorio di Astrofisica e Scienza dello Spazio di Bologna, Via Gobetti 93/3, 40129 Bologna, Italy
e-mail: This email address is being protected from spambots. You need JavaScript enabled to view it.
2
Max-Planck-Institut für Astrophysik, Karl-Schwarzschild-Str 1, 85748 Garching bei München, Germany
3
Department of Physics, Broida Hall, University of California, Santa Barbara, CA 93106-9530, USA
4
Max-Planck Institut für Astronomie, Königstuhl 17, 69117 Heidelberg, Germany
5
UCO/Lick Observatory, University of California Santa Cruz, Santa Cruz, CA 95064, USA
6
Kavli Institute for the Physics and Mathematics of the Universe (Kavli IPMU), 5-1-5 Kashiwanoha, Kashiwa 277-8583, Japan
7
Department of Physics, ETH Zurich, Wolgang-Pauli-Strasse 27, 8093 Zürich, Switzerland
8
Dipartimento di Fisica, Università degli Studi di Milano-Bicocca, Piazza della Scienza 3, 20126 Milano, Italy
Received:
30
October
2020
Accepted:
8
December
2020
Abstract
Enormous Lyα nebulae, extending over 300−500 kpc around quasars, represent the pinnacle of galaxy and cluster formation. Here we present IRAM Plateau de Bure Interferometer observations of the enormous Lyα nebulae “Slug” (z = 2.282) and “Jackpot” (z = 2.041). Our data reveal bright, synchrotron emission associated with the two radio-loud active galactic nuclei embedded in the targeted nebulae as well as molecular gas, as traced via the CO(3−2) line, in three galaxies (two sources in Slug, and one in Jackpot). All of the CO emission is associated with galaxies detected in their rest-frame UV stellar emission. The total mass in molecular gas of these three galaxies [∼(3 − 5) × 1010 M⊙] is comparable with the total ionized gas mass responsible for the diffuse nebular emission. Our observations place limits on the molecular gas emission in the nebulae: the molecular gas surface density is ΣH2 < 12 − 25 M⊙ pc−2 for the Slug nebula and ΣH2 < 34 − 68 M⊙ pc−2 for the Jackpot nebula. These are consistent with the expected molecular gas surface densities, as predicted via photoionization models of the rest-frame UV line emission in the nebulae, and via Lyα absorption in the Jackpot nebula. Compared to other radio-loud quasars at z > 1 and high-redshift radio-loud galaxies, we do not find any strong trends relating the molecular gas reservoirs, the radio power, and the Lyα luminosities of these systems. The significant step in sensitivity required to achieve a detection of the molecular gas from the nebulae, if present, will require a substantial time investment with JVLA, NOEMA, or ALMA.
Key words: galaxies: high-redshift / galaxies: evolution / galaxies: ISM / galaxies: star formation
© ESO 2020
1. Introduction
Diffuse nebulae of hydrogen Lyman-α (Lyα), extending over 50−100 kpc, have been observed around star forming galaxies (e.g., Steidel et al. 2000; Matsuda et al. 2004; Dey et al. 2005; Yang et al. 2009; Wisotzki et al. 2016, 2018; Li et al. 2019; Herenz et al. 2020), high-z radio galaxies (e.g., Keel et al. 1999; Venemans et al. 2002; Miley et al. 2006; Marques-Chaves et al. 2019), and quasars (e.g., Husband et al. 2015; Borisova et al. 2016; Arrigoni-Battaia et al. 2016, 2019; Ginolfi et al. 2018; Farina et al. 2019; Lusso et al. 2019; Drake et al. 2020; Travascio et al. 2020) up to z ∼ 6.5. These large reservoirs of cool (T ∼ 104 K) gas extend well into the circum-galactic medium. They may link the pristine intergalactic medium accreting onto forming galaxies with the material outflowing due to winds, radio jets, or feedback from star formation or nuclear activity. Despite their central role in shaping the growth and evolution of galaxies, Lyα nebulae are still poorly understood. The bright Lyα emission has been imputed to photoionization from active galactic nuclei (AGN; Geach et al. 2009) to fluorence and reflection of the light from an embedded quasar (Cantalupo et al. 2012, 2014); to integrated emission from star-forming satellite galaxies or to material spread in the circum-galactic medium by galactic winds (see, e.g., Steidel et al. 2011); to shock heating of the gas via galactic superwinds (Taniguchi & Shioya 2000); and to cooling from cold accretion (Haiman et al. 2000; Fumagalli et al. 2014; Trebitsch et al. 2016). Furthermore, Lyα photons are likely affected by complex radiative transfer effects, at least on small scales (< 10 kpc) where resonant scattering seems to be important (e.g., Ao et al. 2020).
Four enormous Lyα nebulae (ELANe) stand out because of their exceptional spatial extent (300 − 500 kpc) and total Lyα luminosity LLyα = (0.2 − 1.5) × 1045 erg s−1: the Slug nebula, discovered around the quasar UM287 at z = 2.279 (Cantalupo et al. 2014); the Jackpot nebula, embedding the z = 2.041 quasar SDSS J0841+3921 (Hennawi et al. 2015); the “MAMMOTH-I” nebula in the BOSS1441 overdensity at z = 2.319 (Cai et al. 2017); and the giant nebula around the quasar SDSS J102009.99+104002.7 at z = 3.164 (Arrigoni-Battaia et al. 2018). All of these enormous nebulae harbour several spectroscopically-confirmed galaxies, including a number of AGN and several Lyα emitting galaxies, thus marking some of the most prominent galactic overdensities at these redshifts. The extent of these nebulae exceeds the expected diameter of the dark matter halos of the most massive galaxies (Mhalo ∼ 1012.5 M⊙) at these redshifts. These immense systems thus represent unique laboratories to study galaxy and structure formation at the very high-mass end of the mass spectrum.
Observations combining Lyα, C IV, He II, and Hα provide clues as to the physical properties of the clouds responsible for the diffuse Lyα emission in these ELANe. Interpreting these diagnostics with the support of photoionization models (see, e.g., Hennawi & Prochaska 2013) points to the presence of a population of small (R < 20 pc), sparse (NH < 1020 cm−2) yet dense (nH ≳ 3 cm−3) clouds (Arrigoni-Battaia et al. 2015; Cai et al. 2017; Leibler et al. 2018; Cantalupo et al. 2019). The relatively low Lyα/Hα flux ratio FLyα/FHα = 5.5 ± 1.1 currently observed in a source embedded in the Slug nebula appears broadly consistent with expectations for Case B recombination, thus disfavoring photon-pumping or scatter from the quasar broad line region as the main powering mechanism in this part of the nebula (Leibler et al. 2018).
A critical open question on the nature of ELANe is whether these clouds reach a gas density sufficient to form significant molecular gas. Indeed, dedicated cloud-crushing simulations (e.g., McCourt et al. 2018; Gronke & Oh 2018, 2020) and high resolution cosmological simulations (e.g., Hummels et al. 2019) point toward a scenario in which such dense cold clouds can survive in a hot-halo environment even after shattering in a mist.
Out of the four ELANe known to date, only the MAMMOTH-I nebula has been observed in its molecular gas content, as traced by the carbon monoxide (12C16O, hereafter CO) ground rotational transition CO(1−0) (Emonts et al. 2019). In this source, large reservoirs of molecular gas appear to be associated with galaxies or a group of galaxies in the core of the nebula (see also Yang et al. 2014). Noticeably, the CO emission appears brighter in regions that are devoid of strong Lyα emission. This is in contrast with earlier results on the “Spiderweb” galaxy system, showing widespread atomic carbon, water vapor, and CO emission in the nebula (Emonts et al. 2016; Gullberg et al. 2016). Emonts et al. (2019) suggest that the discrepancy might be attributed to the presence of a strong, AGN-driven radio jet in the Spiderweb, which might cause local thermal instability that leads to gas cooling. In this scenario, the lack of a radio-loud source in the MAMMOTH-I system might explain the smaller reservoir of molecular gas with respect to the Spiderweb system.
In order to investigate the molecular gas content of ELANe, we obtained 3 mm interferometric observations of the Slug and Jackpot nebulae. We targeted the CO(3−2) transition and its underlying dust continuum with the IRAM Plateau de Bure Interferometer (PdBI)/NOrthern Extended Millimeter Array (NOEMA). Both of these ELANe host a radio-loud AGN, a UV-luminous quasar, and other galaxies. This Letter is structured as follows: Sect. 2 describes our CO(3−2) observations. In Sect. 3 we present our results. We discuss the implications of our findings in Sect. 4.
Through this report we assume a ΛCDM cosmology, with H0 = 70 km s−1 Mpc−1, Ωm = 0.3, and ΩΛ = 0.7, and a Kroupa initial mass function to compute star formation rates (SFR). In this cosmological framework, the scale distance at z = 2.041 (z = 2.279) is 8.35 kpc arcsec−1 (8.22 kpc arcsec−1), and the luminosity distance is 15.928 Gpc (18.223 Gpc).
2. Observations
We searched for the CO(3−2) line in the Slug and Jackpot nebulae using PdBI. The line has a rest-frame frequency of ν0 = 345.796 GHz. At z = 2.0 − 2.3, it is redshifted into the 3 mm transparent window of the atmosphere.
Observations of the Slug nebula were carried out in a number of short tracks during 2014 (May 13, 15, 18; June 01; October 17, 18, 19, 20, 21, 25, 26; program IDs: X0B1 and S14CH). Baselines ranged between 15 and 100 m with five or six antennas (compact 5Dq and 6Dq configurations). The tuning frequency of our observations was 105.436 GHz (WideX band 1). The pointing center was set to RA = 00:52:02.400, Dec = +01:01:29.00 (J2000.0), that is to say it was centered on the bright quasar in the nebula. The primary beam of PdBI has a Gaussian profile with a full width at half maximum (FWHM) = 47.8″ at the tuning frequency of our observations, that is, it is large enough to easily accommodate the nebula and it reaches out to the companion radio-loud AGN (see Fig. 1). The quasar 3C 454.3 and the source MWC349 were used for bandpass and flux calibration, while quasars 0106+013 and 0112−017 were repeatedly observed for the amplitude and phase calibrations. The precipitable water vapor was typically ∼5 mm, and with a minimum of 1 − 2 mm (May 15) and a maximum of 5−10 mm (May 13). We processed our data using the June 2014 and October 2014 versions of the GILDAS software. The final cube consists of 16 500 visibilities, corresponding to 13.75 h on source, which is equivalent to six antennas.
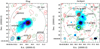 |
Fig. 1. Enormous Lyα nebulae Slug and Jackpot, as seen in Lyα emission (color scale; see Cantalupo et al. 2014; Hennawi et al. 2015), in CO(3−2) (red contours), and 3 mm continuum (green contours). The large dashed circles show the primary beams of our 3 mm observations, while the blue ellipses at the bottom left corner show the synthesized beams. The solid and dotted contours show the positive and negative 2, 3, 4, 5, ...15-σ isophotes, where 1-σ = 122 and 100 μJy beam−1 for the CO(3−2) line maps of the Slug and Jackpot nebulae, respectively, and 1-σ = 28 and 38 μJy beam−1 for the 3 mm continuum of the two systems. Line maps were integrated over 300 km s−1 (see Fig. 2). For Slug, the inset shows the CO map of the galaxy on the eastern side. The synchrotron continuum of the two radio-loud AGN in the two nebulae were also secured at high significance. Conversely, the UV-luminous quasar at the center of Slug and a star-forming galaxy at the northern edge of the Jackpot nebula are the only unambiguous CO detections in our data. No CO line nor 3 mm continuum detection is reported in either nebula. |
Observations of the Jackpot nebula started in 2014 (April 13, 14, 15; program ID: X0B1), and continued in 2017 (May 05, 08, 15, 19, 22; program ID: W16DA). The 2014 data consist of three short visits in 6C configuration. The 2017 data comprise five observations in 8D configuration. Baselines ranged between 20−180 m. The tuning frequency was set to 113.711 GHz. The pointing center was set to RA = 08:41:58.500, Dec = +39:21:21.00 (J2000.0). The primary beam at the tuning frequency is 44.3″, thus fully encompassing the entirety of the nebula (see Fig. 1). The quasars 3C 84, 0851+202, and 0716+714 served as bandpass and flux calibrators, while the quasars 0821+394 and 0923+392 were observed as phase and amplitude calibrators. The precipitable water vapor during the observations ranged between 3 and 15 mm. We processed our data using the June 2014 and May 2017 versions of the GILDAS software. The final data cube comprises 26 428 visibilities, corresponding to 11.80 h, which is equivalent to eight antennas.
We imaged the cubes using the GILDAS suite mapping. Natural weighting was adopted. The beam size is 6.24″ × 4.38″ (∼51 × 36 kpc2 at z = 2.279) for the Slug nebula, and 3.17″ × 2.76″ (∼26 × 23 kpc2) for Jackpot. After the spectral resampling, we masked the channel centered at 103.928 GHz in the Slug observations due to a parasite frequency. We resampled the spectral dimension in 50 km s−1 channels. We also created continuum maps by averaging over the entire observed spectral range, using the task uv_average within mapping. We estimate a root mean square (rms) of 390 μJy beam−1 per 50 km s−1 channel and 437 μJy beam−1 per 50 km s−1 channel for the Slug and Jackpot observations, respectively. In the continuum and line maps, we applied the task clean down to 1.5-σ in a cleaning box of a few pixels centered on the radio-loud AGN.
3. Results
Figure 1 compares the CO and radio continuum maps of the targets of this study, with the continuum–subtracted Lyα maps of the ELANe from Cantalupo et al. (2014) and Hennawi et al. (2015). Figure 2 shows the 3 mm spectra extracted at the position of various sources in the Slug and Jackpot ELANe, as marked in Fig. 1.
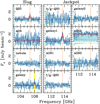 |
Fig. 2. Primary-beam corrected PdBI/NOEMA 3 mm spectra of various sources embedded in the Slug and Jackpot nebulae (see their location in Fig. 1). The adopted channel width is 50 km s−1. The dotted green histograms mark the 1-σ range. Pink and yellow shades highlight the channels used in the line maps in Fig. 1. The thick solid red lines show the fits for the three reported line emitters and two continuum emitters, as described in the text. All of the line detections are clearly associated with optical galactic counterparts. |
3.1. Continuum at 3 mm
We clearly detect the continuum emission of the radio-loud AGN (RL-AGN) in both the Slug (S/N ≈ 7) and Jackpot (S/N ∼ 80) nebulae. No other source is detected in its continuum emission.
We fit the 3 mm spectra of these sources with a constant flux density, using our custom Markov-chain Monte Carlo routine smc. As done previously, we adopted wide Gaussian probability distributions centered on the continuum median value. Table 1 reports the fitted values.
Results from the 3 mm spectral fitting of sources in the targeted ELANe.
If the 3 mm continuum emission arises from dust thermal emission, the result for the integrated infrared luminosities, LIR, computed assuming a modified black body, is LIR ≳ 1013 L⊙ for the AGN in the Slug ELAN, and LIR ≳ 1014 L⊙ for the AGN in the Jackpot ELAN for any Tdust > 35 K. These estimates place these sources among the most luminous IR galaxies. As dust acts as a catalyst for molecular gas formation, such high dust luminosities should be paired with exceptionally luminous CO emission (> 2 mJy, conservatively assuming a low, Milky Way–like CO excitation and a line width of 300 km s−1). Such a high CO luminosity is ruled out by our observations. We therefore conclude that the observed 3 mm continuum emission in these two sources is of nonthermal origin. By comparing the 3 mm flux density from our observations with the 1.4 GHz flux density from FIRST (White et al. 1997), as well as with observations at 4.9 GHz and 8.4 GHz by DiPompeo et al. (2011) for the Jackpot source, we infer radio spectral indexes α = −1.00 ± 0.03 for the radio-loud AGN in the Slug ELAN, and α = −0.461 ± 0.009 for the one in the Jackpot ELAN. No previous estimates of the radio spectral index in the Slug RL-AGN are available in the literature. On the other hand, our estimate of α for the RL-AGN in Jackpot is in agreement with the αfit = −0.5 value quoted in DiPompeo et al. (2011).
3.2. CO lines
In the Slug nebula, we clearly detect CO(3−2) emission at S/N ≈ 7 associated with the UV-luminous quasar UM287. A tentative detection (S/N ≈ 4) is also reported at the position of a UV-detected galaxy at the eastern edge of the system. In the Jackpot system, only a galaxy in the northern part of the system is detected in CO(3−2) (S/N ≈ 13).
We fit the lines with a Gaussian function, using smc. As priors, we assume loose Gaussian probability distributions centered on the ELAN redshift and on the maximum flux density of the line, as well as a Maxwellian probability distribution with a scale width of 300 km s−1 for the line widths. The results are listed in Table 1 and shown as red lines in Fig. 2.
The CO-based redshift of UM287 (z = 2.2824 ± 0.0003) is in excellent agreement with previous estimates based on rest-frame optical and UV lines (Leibler et al. 2018; Cantalupo et al. 2019), and slightly higher than the one reported by Hewett & Wild (2010) (z = 2.279). The line-of-sight velocity difference between the quasar and the other CO-emitting galaxy in Slug is 1850 km s−1, hinting at a physical association of the galaxy with the overdensity hosting the ELAN, although we note that the velocity difference is larger (by a factor of ∼2) than the velocity gradient observed in the nebula based on Hα emission (Leibler et al. 2018). The CO-detected galaxy in the Jackpot nebula has a redshift of z = 2.0407. For comparison, the UV-bright “foreground” quasar in the system has a redshift of z = 2.04537 ± 0.00062 (Hewett & Wild 2010), that is, at a line-of-sight velocity difference of Δv = 460 ± 25 km s−1, which is consistent with a physical association with the same overdensity.
We converted the line fluxes into line luminosities, L′, following, for example, Carilli & Walter (2013):
 (1)
(1)
where Fline is the line integrated flux and DL is the luminosity distance. We then estimated associated molecular gas masses as MH2 =  , where we adopted a CO-to-H2 conversion factor of αCO = 3.6 M⊙ (K km s−1 pc2)−1 from Daddi et al. (2010) (see also Bolatto et al. 2013) and r31 = 0.80 from the z > 2 sample of galaxies in Boogaard et al. (2020). Under these assumptions, we inferred molecular gas masses of (24 ± 3) × 109 M⊙, (13 ± 3) × 109 M⊙, and (48 ± 4) × 109 M⊙ for the quasar in Slug, the galaxy on its eastern side, and for the CO-detected galaxy at the northern end of the Jackpot ELAN, respectively. Table 1 lists all of the measured and inferred quantitities for these galaxies. The line luminosities and associated molecular gas masses in our study are consistent with values reported in other quasar host galaxies at high redshift (see Fig. 3 and the compilations in, e.g., Carilli & Walter 2013; Venemans et al. 2017), as well as in other star forming galaxies at these redshifts (e.g., Tacconi et al. 2018; Aravena et al. 2019).
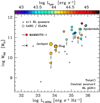 |
Fig. 3. Comparison of molecular gas mass (as traced via CO line emission), radio luminosity, and Lyα luminosity in ELANe, in high-redshift radio galaxies, and in z > 1 radio loud quasars (see Sect. 4 for references). For the Spiderweb, MAMMOTH-I, Slug, and Jackpot systems, we show (i) the total molecular gas mass of the system (circles), (ii) the molecular gas mass of the radio-loud AGN, if any (squares), and (iii) the molecular gas mass of the source considered to be the main powering source of the ELAN (triangles). The apparent correlation between molecular gas and radio luminosity appears to reflect selection effects. No clear correlation is found between the Lyα luminosity and other quantities. The lack of clear scaling relations highlight the complexity and diversity of these systems and of the physical and radiative processes that are occurring. |
We searched for line emission beyond the preselected coordinates from known galaxies using the code findclumps (see Decarli et al. 2019). Within the primary beam radii of the two ELAN pointings, we find only one additional line candidate with S/N > 5 in the Slug ELAN: it is centered at RA = 00:52:03.05 and Dec = +01:01:23.0 (J2000.0) and has an S/N = 5.15. However, the line is statistically consistent with noise features, and it resides at the edge of the bandwidth (νobs = 106.55 GHz), thus suggesting that the candidate is not a real astrophysical source. No additional lines are found in the Jackpot ELAN at S/N > 5.
4. Discussion and conclusions
We presented 3 mm observations of two enormous Lyα nebulae at z ∼ 2, the Slug and the Jackpot systems. Both nebulae harbour several galaxies, including a radio-loud and various radio-quiet AGN. We detect 3 mm continuum emission in the two radio-loud AGN and argue that it is dominated by the nonthermal synchrotron emission. We also detect CO line emission in three sources: the UV-bright quasar in the core of the Slug nebula and two star-forming galaxies in the outskirts of the two ELANe. Using standard assumptions, we converted the CO line luminosities into molecular gas masses.
We find that the total mass in molecular gas in the two ELANe is MH2 = (37 ± 4) × 109 M⊙ in Slug and MH2 = (48 ± 4) × 109 M⊙ in Jackpot. These masses are comparable with the mass of cool (T ∼ 104 K) gas responsible for the nebular Lyα emission, albeit the former is concentrated in three individual galaxies, whereas the latter is spread on scales of several hundreds of kiloparsecs. In Fig. 3 we compare the molecular gas masses with the diffuse Lyα luminosity and the radio luminosities of ELANe of various high-redshift radio galaxies (De Breuck et al. 2000; Reuland et al. 2003; Miley & De Breuck 2008; Emonts et al. 2014, 2019) and of radio-loud quasars at z > 1 (from the compilation in Carilli & Walter 2013). We do not find evidence of a correlation between Lyα luminosity and either CO or radio luminosity within the sampled ranges. We find an apparent correlation between molecular gas mass and radio luminosity; however, this is likely a by-product of selection effects. Because radio selection historically drew the identification of these systems, which were then searched for CO emission, the faint-radio, bright-CO corner of the plot is undersampled, with the MAMMOTH-I being a clear example deviating from the apparent relation. At the same time, the detection of faint CO lines might be hindered in the presence of exceptionally bright synchrotron emission. We conclude that we find no evidence for a connection between radio luminosity and molecular gas content.
Under the same assumptions adopted for our line detections, and postulating a line width of 300 km s−1, the non-detection of CO associated with the nebulae implies a molecular gas mass limit between (1.8−3.6) × 1010 M⊙ beam−1 for the Slug nebula and (1.6−3.3) × 1010 M⊙ beam−1 for the Jackpot nebula, depending on the position within the primary beam (assuming 3-σ significance). This translates into limits on the beam-averaged (assuming beam areas are of 1440 kpc2 and 470 kpc2 for the Slug and the Jackpot nebulae, respectively) surface molecular gas mass distribution ΣH2 < 12 − 25 M⊙ pc−2 for the Slug nebula and ΣH2 < 34 − 68 M⊙ pc−2 for the Jackpot nebula, or molecular gas column densities of NH2 < (0.75 − 1.6) × 1021 cm−2 for Slug and NH2 < (2.1 − 4.2) × 1021 cm−2 for Jackpot. Our limits exclude gas surface density regimes typical of starbursting environments. For comparison, the beam-averaged surface density of molecular gas measured in the circum-galactic medium of Spiderweb by Emonts et al. (2016) is ΣH2 = 35 ± 11 M⊙ pc−2, that is to say it is comparable with the limits set by our observations in Slug and Jackpot. The photoionization analysis presented by Arrigoni-Battaia et al. (2015) suggests a column density of NH ≲ 1020 cm−2, and Hennawi et al. (2015) estimate a column density of NH ∼ 1020.4 ± 0.4 cm−2 based on the Lyα absorption on the line-of-sight of the background quasar.
Arrigoni-Battaia et al. (2015) find that the nebulae likely host a population of dense (nH ≳ 3 cm−3), sparse clouds. The lack of 3 mm continuum signal from the nebulae also place loose limits on the star formation occurring in these clouds. Assuming that the dust emission can be modeled as a modified black body with Tdust = 35 K and β = 1.6, we infer limits on the surface density of star formation of ΣSFR < 0.24 and 0.79 M⊙ yr−1 kpc−2 for the Slug and Jackpot nebulae, respectively. These limits only exclude rather extreme, starburst-like SFR surface densities; such intense star formation activity in the nebulae is already ruled out by the much tighter constraints that our observations place on ΣH2, provided that gas in the ELANe follows the “star formation law” observed in local galaxies (Bigiel et al. 2008; Leroy et al. 2011; Schruba et al. 2011).
Significantly deeper observations of molecular gas in ELANe are required in order to expose the molecular content (if present) of the diffuse material associated with the Lyα emission, and to conclusively distinguish between the different physical mechanisms that have been proposed to regulate the interaction between the radio jets and the growth and suppression of molecular gas reservoirs in ELANe and high–redshift radio galaxies. Such observations, despite being expensive in terms of telescope time, may still be within reach with IRAM/NOEMA, ALMA, and JVLA.
Acknowledgments
We thank the referee, B. Emonts, for his feedback on the manuscript that allowed us to improve its quality. This work is based on observations carried out under projects X0B1, S14CH, W16DA with the IRAM Plateau de Bure/NOEMA Interferometer. IRAM is supported by INSU/CNRS (France), MPG (Germany) and IGN (Spain). The research leading to these results has received funding from the European Union’s Horizon 2020 research and innovation program under grant agreement No 730562 [RadioNet]. We thank the IRAM staff and local contacts for their help and support in the data processing. SC gratefully acknowledges support from the Swiss National Science Foundation grant PP00P2_190092 and from the European Research Council (ERC) under the European Union’s Horizon 2020 research and innovation programme grant agreement No 864361 (CosmicWeb).
References
- Aravena, M., Decarli, R., Gónzalez-López, J., et al. 2019, ApJ, 882, 136 [CrossRef] [Google Scholar]
- Arrigoni-Battaia, F., Hennawi, J. F., Prochaska, J. X., & Cantalupo, S. 2015, ApJ, 809, 163 [NASA ADS] [CrossRef] [Google Scholar]
- Arrigoni-Battaia, F., Hennawi, J. F., Cantalupo, S., & Prochaska, J. X. 2016, ApJ, 829, 3 [NASA ADS] [CrossRef] [Google Scholar]
- Arrigoni-Battaia, F., Prochaska, J. X., Hennawi, J. F., et al. 2018, MNRAS, 473, 3907 [NASA ADS] [CrossRef] [Google Scholar]
- Arrigoni-Battaia, F., Hennawi, J. F., Prochaska, J. X., et al. 2019, MNRAS, 482, 3162 [NASA ADS] [CrossRef] [Google Scholar]
- Ao, Y., Zheng, Z., Henkel, C., et al. 2020, Nat. Astron., 4, 670 [CrossRef] [Google Scholar]
- Bigiel, F., Leroy, A., Walter, F., et al. 2008, AJ, 136, 2846 [NASA ADS] [CrossRef] [Google Scholar]
- Bolatto, A. D., Wolfire, M., & Leroy, A. K. 2013, ARA&A, 51, 207 [Google Scholar]
- Boogaard, L. A., van der Werf, P., Weiss, A., et al. 2020, ApJ, 902, 109 [CrossRef] [Google Scholar]
- Borisova, E., Cantalupo, S., Lilly, S. J., et al. 2016, ApJ, 831, 39 [NASA ADS] [CrossRef] [Google Scholar]
- Cai, Z., Fan, X., Yang, Y., et al. 2017, ApJ, 837, 71 [NASA ADS] [CrossRef] [Google Scholar]
- Cantalupo, S., Lilly, S. J., & Haehnelt, M. G. 2012, MNRAS, 425, 1992 [NASA ADS] [CrossRef] [Google Scholar]
- Cantalupo, S., Arrigoni-Battaia, F., Prochaska, J. X., Hennawi, J. F., & Madau, P. 2014, Nature, 506, 63 [NASA ADS] [CrossRef] [Google Scholar]
- Cantalupo, S., Pezzulli, G., Lilly, S. J., et al. 2019, MNRAS, 483, 5188 [NASA ADS] [CrossRef] [Google Scholar]
- Carilli, C. L., & Walter, F. 2013, ARA&A, 51, 105 [NASA ADS] [CrossRef] [EDP Sciences] [Google Scholar]
- Daddi, E., Bournaud, F., Walter, F., et al. 2010, ApJ, 713, 686 [NASA ADS] [CrossRef] [Google Scholar]
- De Breuck, C., Röttgering, H., Miley, G., van Breugel, W., & Best, P. 2000, A&A, 362, 519 [Google Scholar]
- Decarli, R., Walter, F., Gónzalez-López, J., et al. 2019, ApJ, 882, 138 [Google Scholar]
- Dey, A., Bian, C., Soifer, B. T., et al. 2005, ApJ, 629, 654 [NASA ADS] [CrossRef] [Google Scholar]
- DiPompeo, M. A., Brotherton, M. S., De Breuck, C., & Laurent-Muehleisen, S. 2011, ApJ, 743, 71 [NASA ADS] [CrossRef] [Google Scholar]
- Drake, A. B., Walter, F., Novak, M., et al. 2020, ApJ, 902, 37 [CrossRef] [Google Scholar]
- Emonts, B. H. C., Norris, R. P., Feain, I., et al. 2014, MNRAS, 438, 2898 [NASA ADS] [CrossRef] [Google Scholar]
- Emonts, B. H. C., Lehnert, M. D., Villar-Martín, M., et al. 2016, Science, 354, 1128 [NASA ADS] [CrossRef] [Google Scholar]
- Emonts, B. H. C., Cai, Z., Prochaska, J. X., Li, Q., & Lehnert, M. D. 2019, ApJ, 887, 86 [CrossRef] [Google Scholar]
- Farina, E. P., Arrigoni-Battaia, F., Costa, T., et al. 2019, ApJ, 887, 196 [NASA ADS] [CrossRef] [Google Scholar]
- Fumagalli, M., Hennawi, J. F., Prochaska, J. X., et al. 2014, ApJ, 780, 74 [CrossRef] [Google Scholar]
- Geach, J. E., Alexander, D. M., Lehmer, B. D., et al. 2009, ApJ, 700, 1 [NASA ADS] [CrossRef] [Google Scholar]
- Ginolfi, M., Maiolino, R., Carniani, S., et al. 2018, MNRAS, 476, 2421 [NASA ADS] [CrossRef] [Google Scholar]
- Gronke, M., & Oh, S. P. 2018, MNRAS, 480, L111 [NASA ADS] [CrossRef] [Google Scholar]
- Gronke, M., & Oh, S. P. 2020, MNRAS, 494, L27 [CrossRef] [Google Scholar]
- Gullberg, B., Lehnert, M. D., De Breuck, C., et al. 2016, A&A, 591, A73 [NASA ADS] [CrossRef] [EDP Sciences] [Google Scholar]
- Haiman, Z., Spaans, M., & Quataert, E. 2000, ApJ, 537, L5 [NASA ADS] [CrossRef] [Google Scholar]
- Hennawi, J. F., & Prochaska, J. X. 2013, ApJ, 766, 58 [NASA ADS] [CrossRef] [Google Scholar]
- Hennawi, J. F., Prochaska, J. X., Cantalupo, S., & Arrigoni-Battaia, F. 2015, Science, 348, 779 [NASA ADS] [CrossRef] [PubMed] [Google Scholar]
- Herenz, E. Ch., Hayes, M., & Scarlata, C. 2020, A&A, 642, A55 [CrossRef] [EDP Sciences] [Google Scholar]
- Hewett, P. C., & Wild, V. 2010, MNRAS, 405, 2302 [NASA ADS] [Google Scholar]
- Hummels, C. B., Smith, B. D., Hopkins, P. F., et al. 2019, ApJ, 882, 156 [CrossRef] [Google Scholar]
- Husband, K., Bremer, M. N., Stanway, E. R., & Lehnert, M. D. 2015, MNRAS, 452, 2388 [NASA ADS] [CrossRef] [Google Scholar]
- Keel, W. C., Cohen, S. H., Windhorst, R. A., & Waddington, I. 1999, AJ, 118, 2547 [NASA ADS] [CrossRef] [Google Scholar]
- Leibler, C. N., Cantalupo, S., Holden, B. P., & Madau, P. 2018, MNRAS, 480, 2094 [CrossRef] [Google Scholar]
- Leroy, A. K., Bolatto, A., Gordon, K., et al. 2011, ApJ, 737, 12 [Google Scholar]
- Li, Q., Cai, Z., Prochaska, J. X., et al. 2019, ApJ, 875, 130 [NASA ADS] [CrossRef] [Google Scholar]
- Lusso, E., Fumagalli, M., Fossati, M., et al. 2019, MNRAS, 485, L62 [NASA ADS] [Google Scholar]
- Marques-Chaves, R., Pérez-Fournon, I., Villar-Martín, M., et al. 2019, A&A, 629, A23 [CrossRef] [EDP Sciences] [Google Scholar]
- Matsuda, Y., Yamada, T., Hayashino, T., et al. 2004, AJ, 128, 569 [NASA ADS] [CrossRef] [Google Scholar]
- McCourt, M., Oh, S. P., O’Leary, R., & Madigan, A.-M. 2018, MNRAS, 473, 5407 [NASA ADS] [CrossRef] [Google Scholar]
- Miley, G. K., & De Breuck, C. 2008, A&ARv, 15, 67 [NASA ADS] [CrossRef] [Google Scholar]
- Miley, G. K., Overzier, R. A., Zirm, A. W., et al. 2006, ApJ, 650, L29 [NASA ADS] [CrossRef] [Google Scholar]
- Reuland, M., van Breugel, W., Röttgering, H., et al. 2003, ApJ, 592, 755 [NASA ADS] [CrossRef] [Google Scholar]
- Schruba, A., Leroy, A. K., Walter, F., et al. 2011, AJ, 142, 37 [NASA ADS] [CrossRef] [Google Scholar]
- Steidel, C. C., Adelberger, K. L., Shapley, A. E., et al. 2000, ApJ, 532, 170 [NASA ADS] [CrossRef] [Google Scholar]
- Steidel, C. C., Bogosavljevic, M., Shapley, A. E., et al. 2011, ApJ, 736, 160 [NASA ADS] [CrossRef] [Google Scholar]
- Tacconi, L. J., Genzel, R., Saintonge, A., et al. 2018, ApJ, 853, 179 [NASA ADS] [CrossRef] [Google Scholar]
- Taniguchi, Y., & Shioya, Y. 2000, ApJ, 532, L13 [NASA ADS] [CrossRef] [Google Scholar]
- Travascio, A., Zappacosta, L., Cantalupo, S., et al. 2020, A&A, 635, A157 [Google Scholar]
- Trebitsch, M., Verhamme, A., Blaizot, J., & Rosdahl, J. 2016, A&A, 593, A122 [NASA ADS] [CrossRef] [EDP Sciences] [Google Scholar]
- Venemans, B. P., Kurk, J. D., Miley, G. K., et al. 2002, ApJ, 569, L11 [NASA ADS] [CrossRef] [Google Scholar]
- Venemans, B. P., Walter, F., Decarli, R., et al. 2017, ApJ, 845, 154 [NASA ADS] [CrossRef] [Google Scholar]
- White, R. L., Becker, R. H., Helfand, D. J., & Gregg, M. D. 1997, ApJ, 475, 479d [NASA ADS] [CrossRef] [Google Scholar]
- Wisotzki, L., Bacon, R., Blaizot, J., et al. 2016, A&A, 587, A98 [NASA ADS] [CrossRef] [EDP Sciences] [Google Scholar]
- Wisotzki, L., Bacon, R., Brinchmann, J., et al. 2018, Nature, 562, 229 [NASA ADS] [CrossRef] [Google Scholar]
- Yang, Y., Zabludoff, A., Tremonti, C., Eisenstein, D., & Davé, R. 2009, ApJ, 693, 1579 [NASA ADS] [CrossRef] [Google Scholar]
- Yang, Y., Walter, F., Decarli, R., et al. 2014, ApJ, 784, 171 [CrossRef] [Google Scholar]
All Tables
All Figures
|
Fig. 1. Enormous Lyα nebulae Slug and Jackpot, as seen in Lyα emission (color scale; see Cantalupo et al. 2014; Hennawi et al. 2015), in CO(3−2) (red contours), and 3 mm continuum (green contours). The large dashed circles show the primary beams of our 3 mm observations, while the blue ellipses at the bottom left corner show the synthesized beams. The solid and dotted contours show the positive and negative 2, 3, 4, 5, ...15-σ isophotes, where 1-σ = 122 and 100 μJy beam−1 for the CO(3−2) line maps of the Slug and Jackpot nebulae, respectively, and 1-σ = 28 and 38 μJy beam−1 for the 3 mm continuum of the two systems. Line maps were integrated over 300 km s−1 (see Fig. 2). For Slug, the inset shows the CO map of the galaxy on the eastern side. The synchrotron continuum of the two radio-loud AGN in the two nebulae were also secured at high significance. Conversely, the UV-luminous quasar at the center of Slug and a star-forming galaxy at the northern edge of the Jackpot nebula are the only unambiguous CO detections in our data. No CO line nor 3 mm continuum detection is reported in either nebula. |
| In the text | |
|
Fig. 2. Primary-beam corrected PdBI/NOEMA 3 mm spectra of various sources embedded in the Slug and Jackpot nebulae (see their location in Fig. 1). The adopted channel width is 50 km s−1. The dotted green histograms mark the 1-σ range. Pink and yellow shades highlight the channels used in the line maps in Fig. 1. The thick solid red lines show the fits for the three reported line emitters and two continuum emitters, as described in the text. All of the line detections are clearly associated with optical galactic counterparts. |
| In the text | |
|
Fig. 3. Comparison of molecular gas mass (as traced via CO line emission), radio luminosity, and Lyα luminosity in ELANe, in high-redshift radio galaxies, and in z > 1 radio loud quasars (see Sect. 4 for references). For the Spiderweb, MAMMOTH-I, Slug, and Jackpot systems, we show (i) the total molecular gas mass of the system (circles), (ii) the molecular gas mass of the radio-loud AGN, if any (squares), and (iii) the molecular gas mass of the source considered to be the main powering source of the ELAN (triangles). The apparent correlation between molecular gas and radio luminosity appears to reflect selection effects. No clear correlation is found between the Lyα luminosity and other quantities. The lack of clear scaling relations highlight the complexity and diversity of these systems and of the physical and radiative processes that are occurring. |
| In the text | |
Current usage metrics show cumulative count of Article Views (full-text article views including HTML views, PDF and ePub downloads, according to the available data) and Abstracts Views on Vision4Press platform.
Data correspond to usage on the plateform after 2015. The current usage metrics is available 48-96 hours after online publication and is updated daily on week days.
Initial download of the metrics may take a while.