Fig. 7
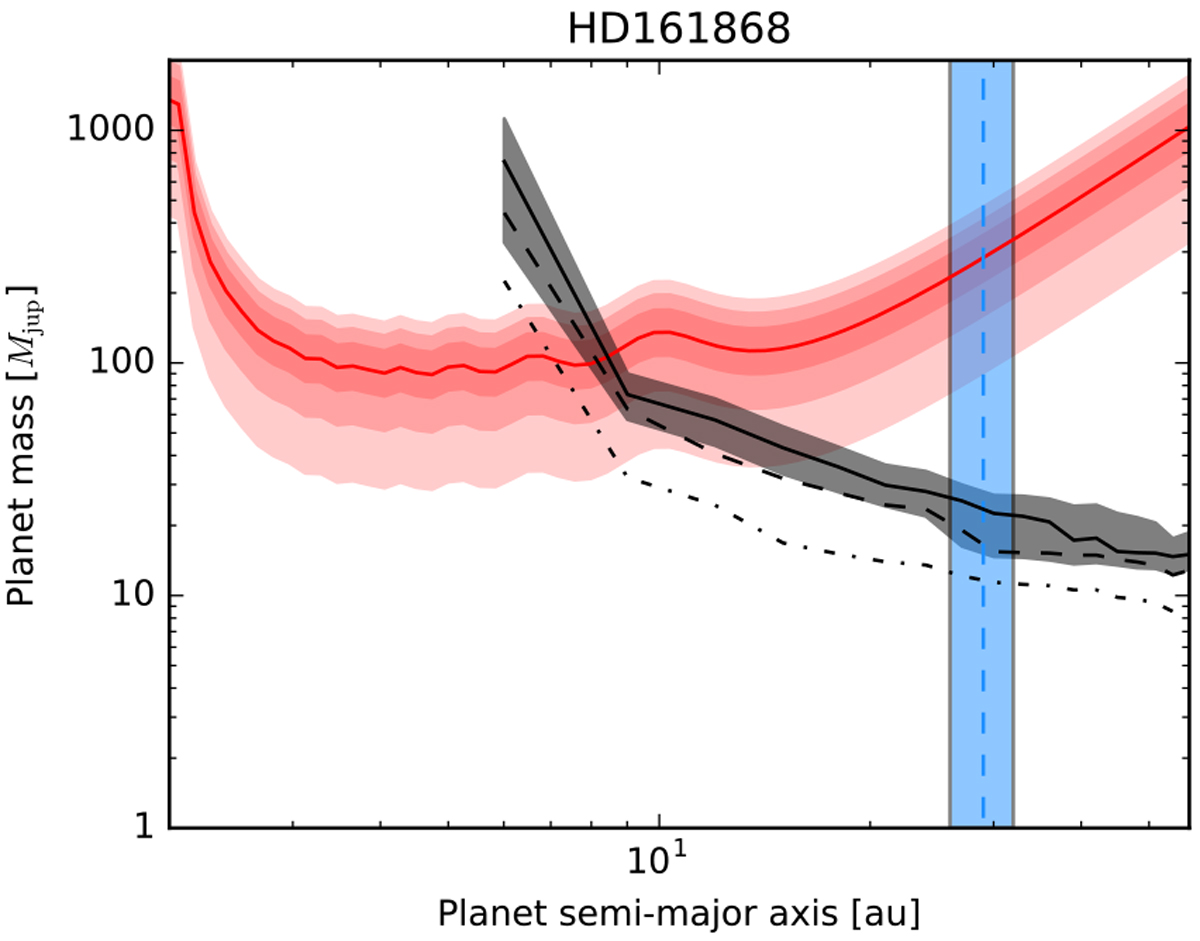
Proper motion anomaly analysis from Kervella et al. (2019) for HD 161868. The red line is the relation between the companion’s mass (in Jupiter masses) and orbital radius (in au) that can explain the observed PMa, and the red shaded areas (progressively darker) are the 1, 2, and 3σ uncertainties. The black solid line and black shaded area denote the achieved 5σ mass detection limits from the LIStEN observations with its uncertainty, together with the 3σ (dashed line) and 1σ (dotted line). The blue dashed line and shaded area represents the position and uncertainty of the inner belt derived via SED fitting. The position of the resolved outer belt of HD 161868 is not visible in the field of view.
Current usage metrics show cumulative count of Article Views (full-text article views including HTML views, PDF and ePub downloads, according to the available data) and Abstracts Views on Vision4Press platform.
Data correspond to usage on the plateform after 2015. The current usage metrics is available 48-96 hours after online publication and is updated daily on week days.
Initial download of the metrics may take a while.