Open Access
Fig. 6
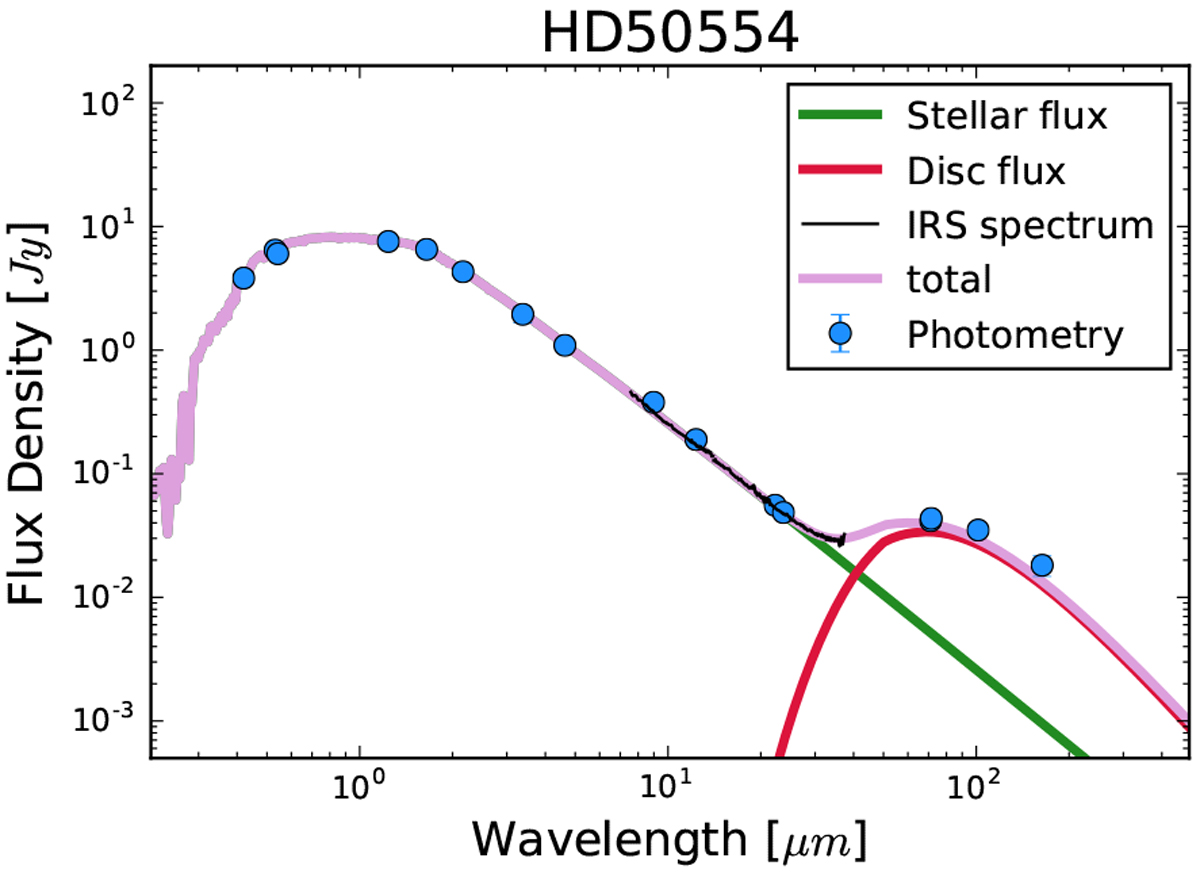
Flux density distribution of HD 50554. The blue points are the photometric datapoints found in the literature, the black line is the IRS spectrum, and the green and red lines are the fitted stellar and disc fluxes, respectively.
Current usage metrics show cumulative count of Article Views (full-text article views including HTML views, PDF and ePub downloads, according to the available data) and Abstracts Views on Vision4Press platform.
Data correspond to usage on the plateform after 2015. The current usage metrics is available 48-96 hours after online publication and is updated daily on week days.
Initial download of the metrics may take a while.