Fig. A.3
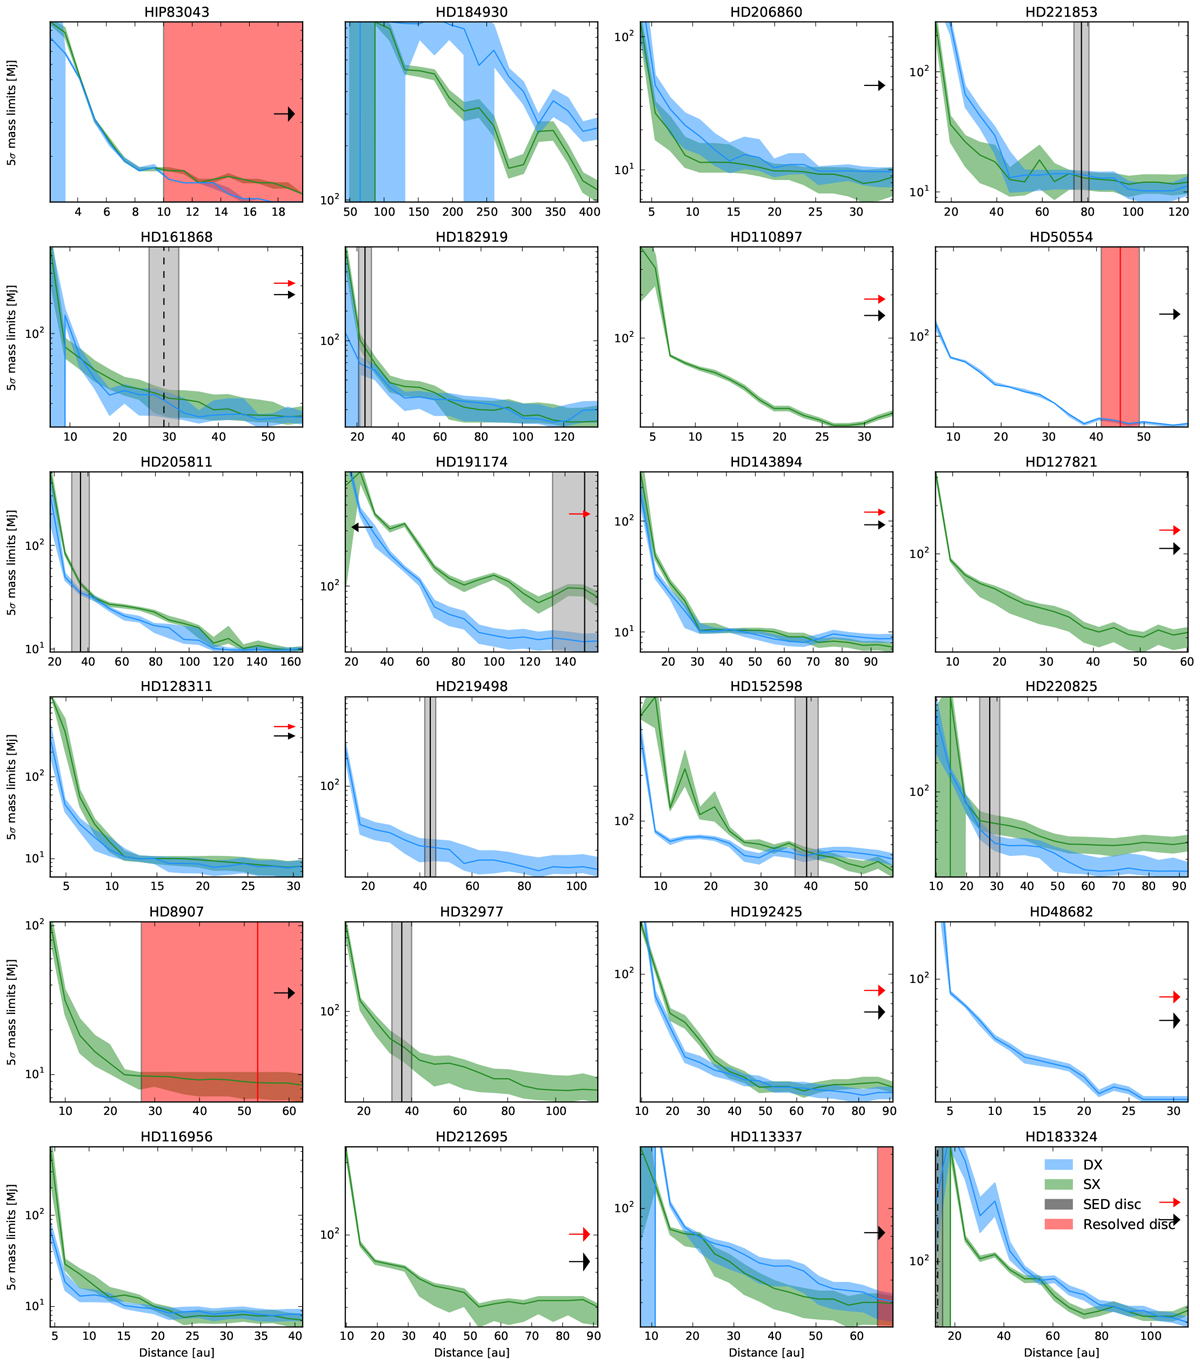
Achieved mass limits for all of the DD-hosting targets in the LIStEN survey. The blue line and blue shaded area represent the 5σ mass detection limit for the DX mirror with its lower and upper bound (estimated as the 25 and 75% quantiles). Similarly, the green line and green shaded area indicate the mass limit for the SX mirror. The red line and shaded area show the position (and uncertainty) for the resolved disc image (where applicable), while the black line and shaded area give the position of the SED-derived disc. If the system has two belts the inner one is shown as a dotted line and the outer one asa solid line. If the disc (either a single belt, one of two belts, or both belts) is not visible in the field of view, it is indicated with a red or black arrow (for the SED-inferred and resolved disc, respectively).
Current usage metrics show cumulative count of Article Views (full-text article views including HTML views, PDF and ePub downloads, according to the available data) and Abstracts Views on Vision4Press platform.
Data correspond to usage on the plateform after 2015. The current usage metrics is available 48-96 hours after online publication and is updated daily on week days.
Initial download of the metrics may take a while.