Fig. 6.
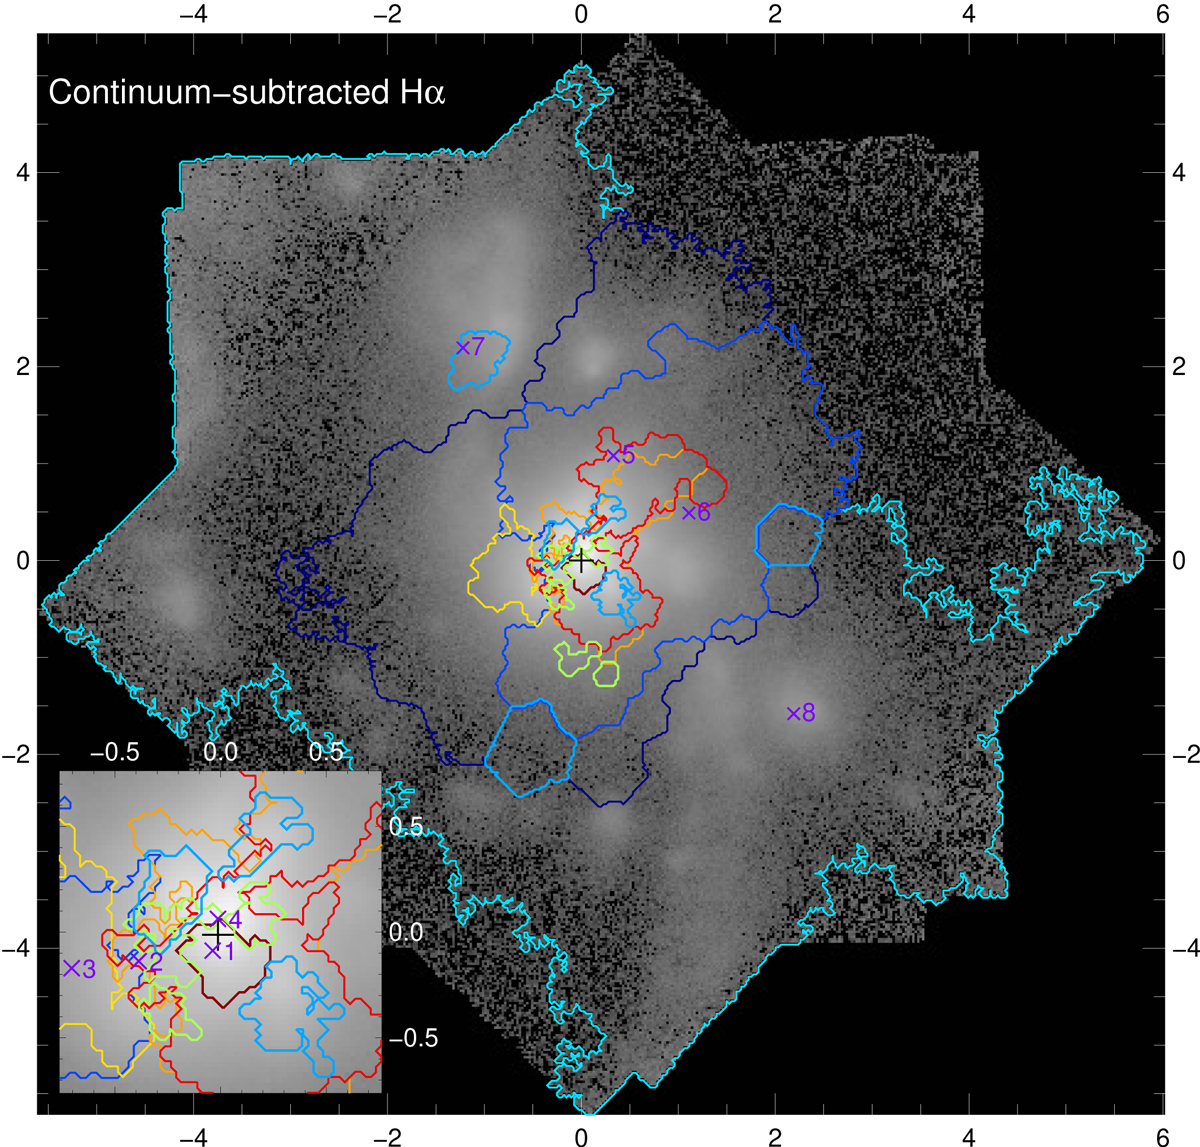
Outlines of the nine kinematic components shown in Fig. 5 overlaid on the continuum-subtracted Hα image from Fig. 1. The contours are colour-coded according to the labels identifying each component in Fig. 5. To ease the readability of the figure, we omitted holes within components and regions smaller than N = 50 spaxels disconnected from the main body of the component. The purple x symbols and numbers indicate the bins whose spectra are discussed in Appendix A. Those corresponding to bins in the inner ![]() are indicated only in the inset to avoid clutter.
are indicated only in the inset to avoid clutter.
Current usage metrics show cumulative count of Article Views (full-text article views including HTML views, PDF and ePub downloads, according to the available data) and Abstracts Views on Vision4Press platform.
Data correspond to usage on the plateform after 2015. The current usage metrics is available 48-96 hours after online publication and is updated daily on week days.
Initial download of the metrics may take a while.