Fig. 5.
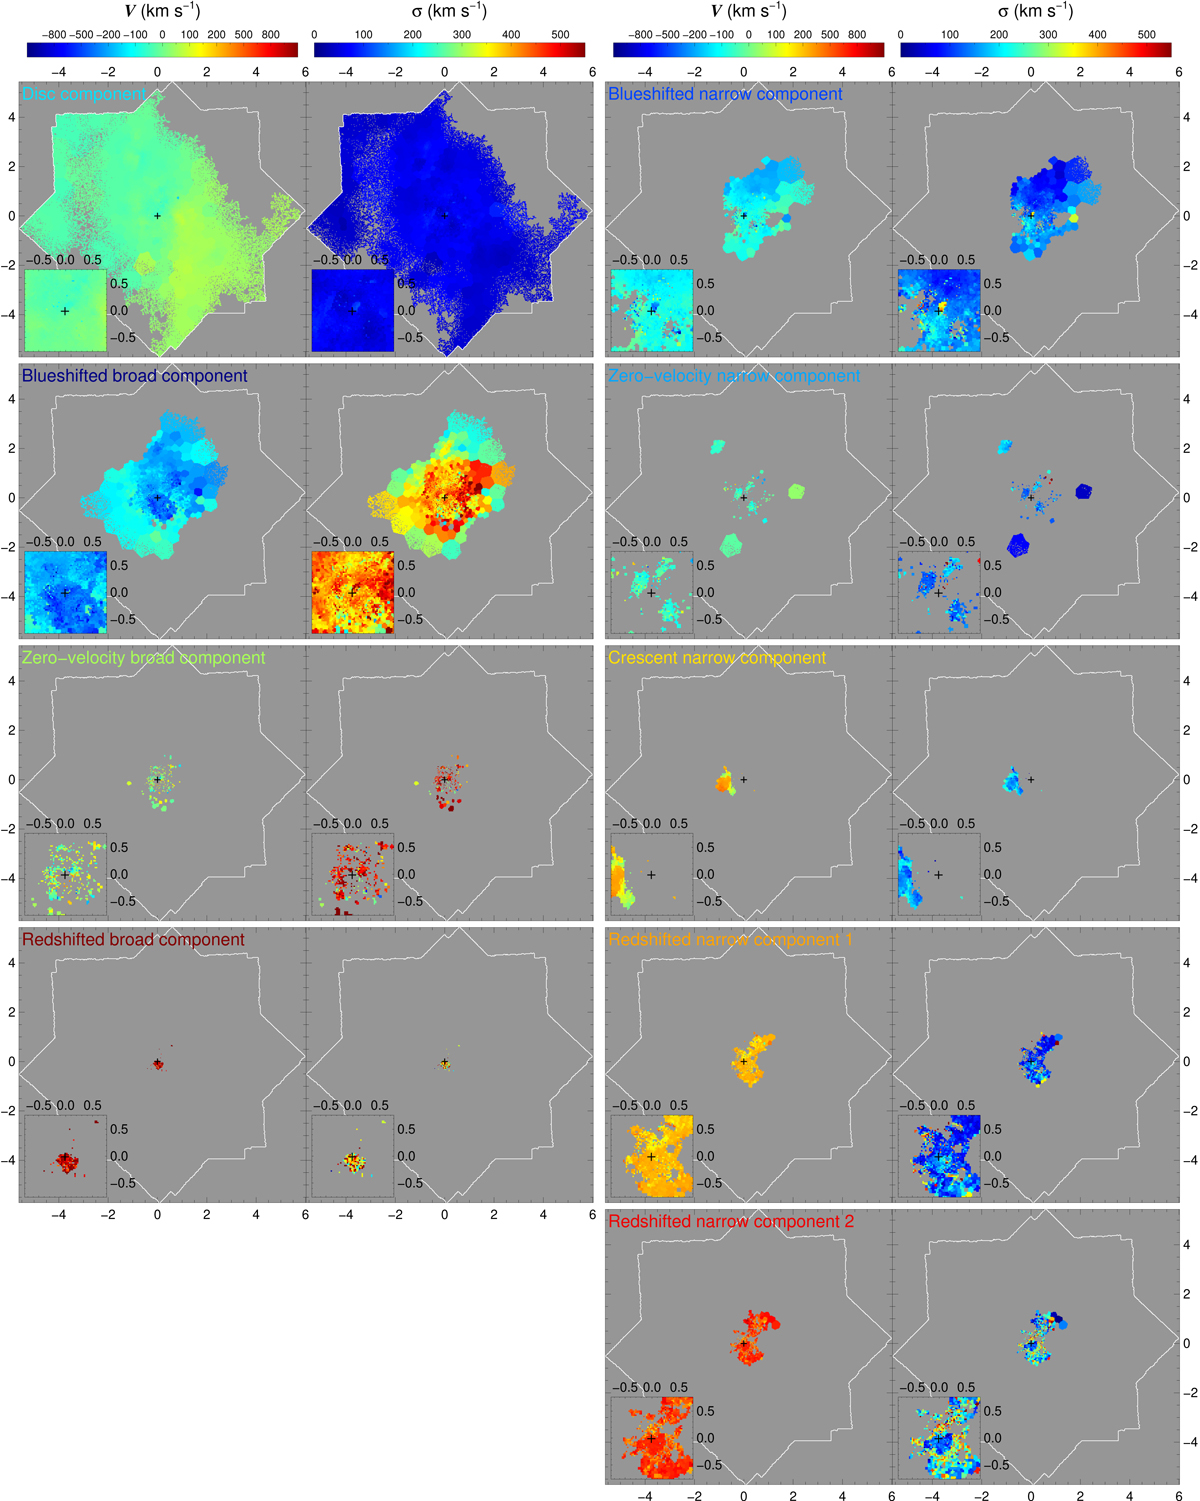
Kinematic maps of kinematically defined components. They are obtained from fits made accounting for all the emission lines of interest (Sect. 3.6) simultaneously. Nine sets of panels are shown, one for each of the kinematic components identified in the circumnuclear medium of NGC 7130. For each set, the left-hand panel corresponds to the velocity map, and the right-hand panel corresponds to the velocity dispersion map. The velocity colour bar is set so the spacing between velocity steps for |Vgas| > 200 km s−1 is three times larger than for |Vgas| < 200 km s−1. The zero in velocity corresponds to z = 0.016221 (cz = 4863 km s−1; see Sect. 4.2). The labels identifying components are given colours that are used consistently in all the plots in this article.
Current usage metrics show cumulative count of Article Views (full-text article views including HTML views, PDF and ePub downloads, according to the available data) and Abstracts Views on Vision4Press platform.
Data correspond to usage on the plateform after 2015. The current usage metrics is available 48-96 hours after online publication and is updated daily on week days.
Initial download of the metrics may take a while.