Fig. A.1.
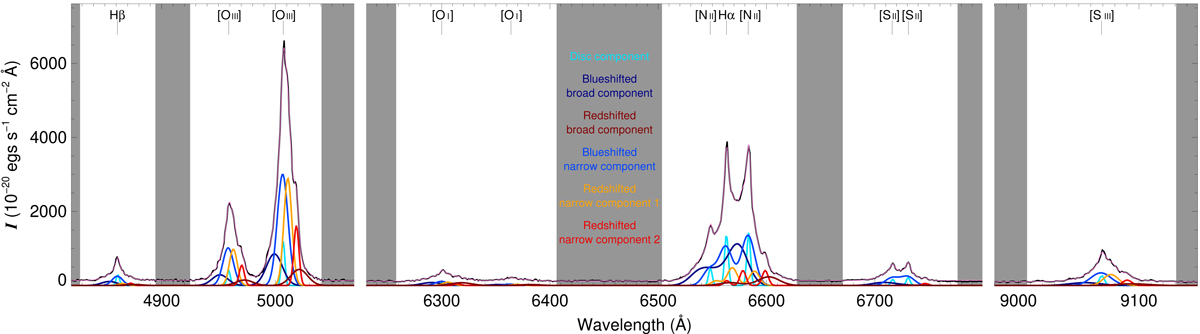
Spectrum of Voronoi bin discussed as Example 1 in Appendix A, and indicated by a number ‘1’ in Fig 6. The black line describes the spectrum and the almost coincident purple line describes the fit. The contribution of the six components in this fit are indicated by curves, colour-coded as in Figs. 5 and 6. The shaded areas were masked away while using pyGandALF. The wavelengths are displayed at the rest frame of z = 0.016151.
Current usage metrics show cumulative count of Article Views (full-text article views including HTML views, PDF and ePub downloads, according to the available data) and Abstracts Views on Vision4Press platform.
Data correspond to usage on the plateform after 2015. The current usage metrics is available 48-96 hours after online publication and is updated daily on week days.
Initial download of the metrics may take a while.