Fig. 13.
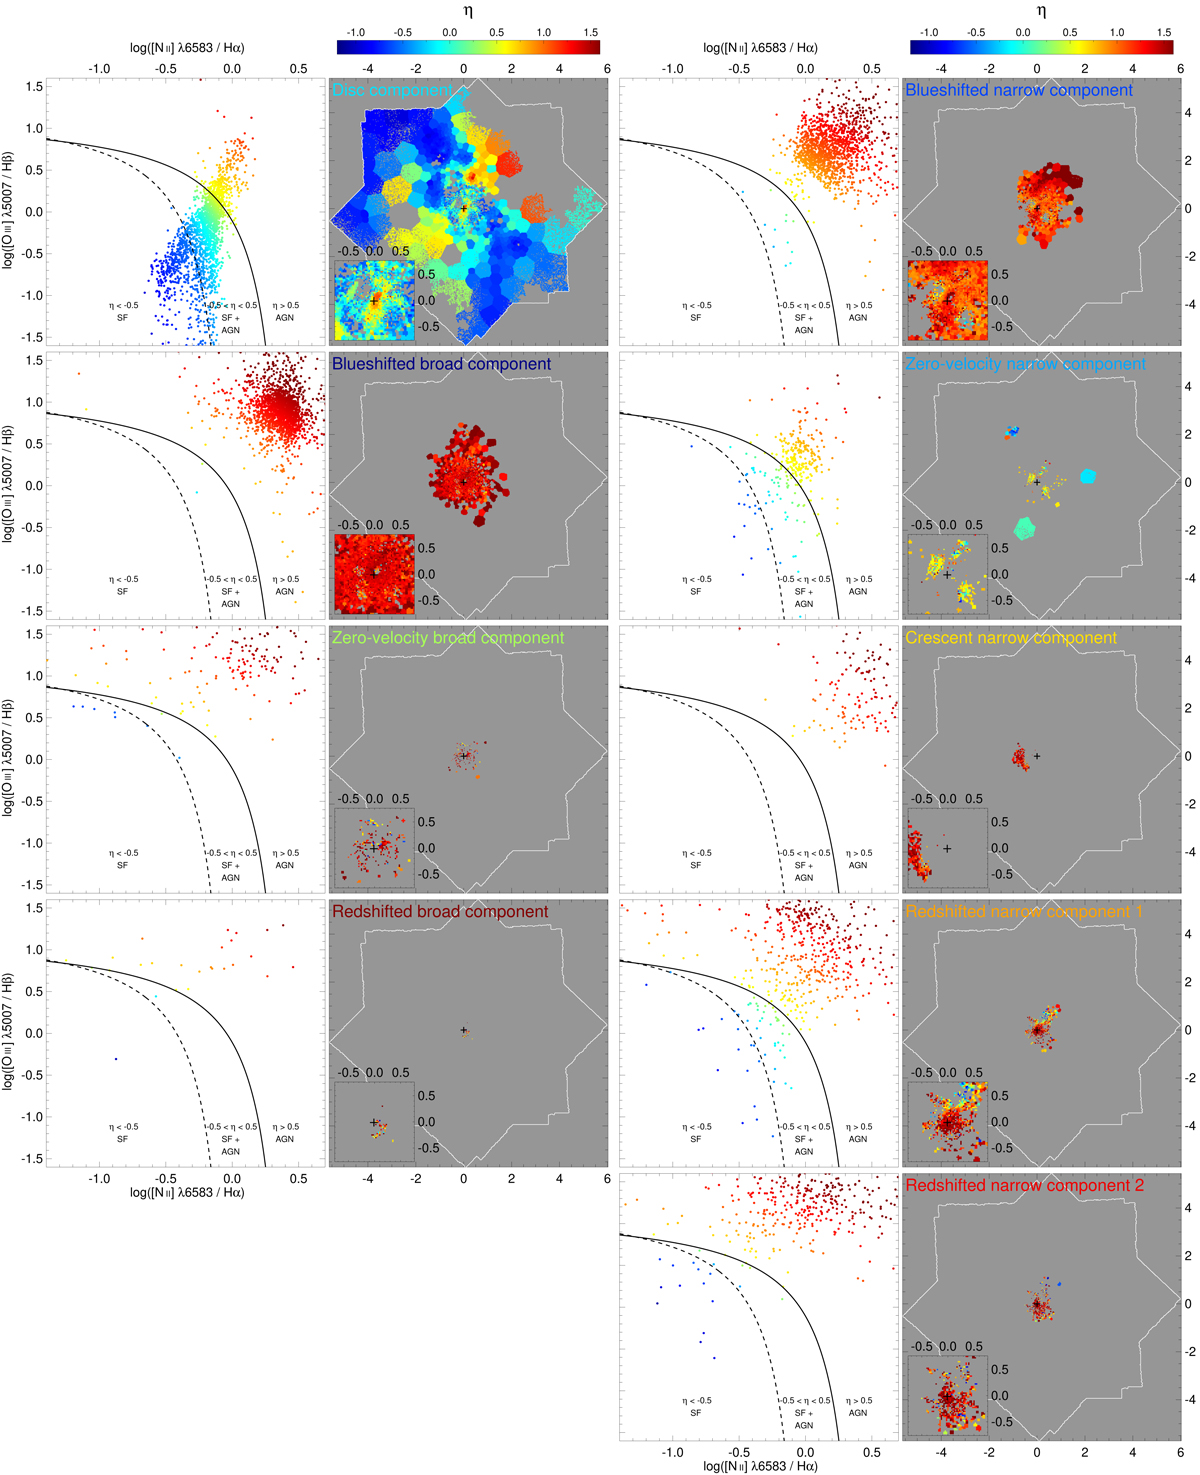
Nine sets of two panels are shown, one for each of the kinematic components. For each set, the left-hand panel corresponds to the [O III] λ5007/Hβ versus ([S II] λ6716+[S II] λ6371)/Hα BPT diagram used to build the resolved BPT map in the right-hand panel. The lines delimiting the regions in the BPT diagram are from Kewley et al. (2006).
Current usage metrics show cumulative count of Article Views (full-text article views including HTML views, PDF and ePub downloads, according to the available data) and Abstracts Views on Vision4Press platform.
Data correspond to usage on the plateform after 2015. The current usage metrics is available 48-96 hours after online publication and is updated daily on week days.
Initial download of the metrics may take a while.