Fig. 1.
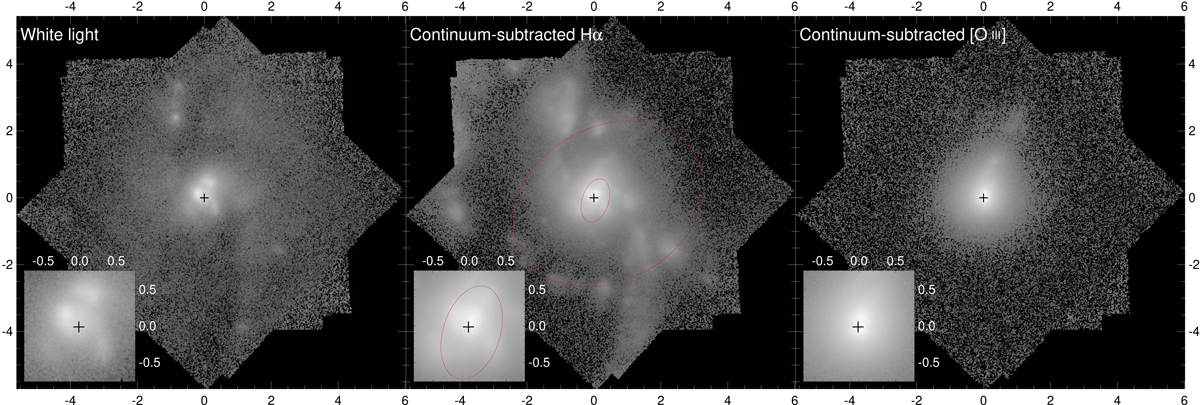
Left panel: white-light image of the centre of NGC 7130 obtained from integrating the reduced MUSE data cube along the spectral direction. Middle panel: continuum-subtracted Hα image obtained from the same data cube. The red ellipses indicate the outline of the nuclear rings (see Sect. 4.3). Right panel: continuum-subtracted [O III] λ5007 image. The intensities are scaled logarithmically. In this and all subsequent maps, the plus sign indicates the inferred galaxy centre and the insets show an enlarged version of the centremost region of the galaxy. The axes are in arcseconds. North is up and east is left.
Current usage metrics show cumulative count of Article Views (full-text article views including HTML views, PDF and ePub downloads, according to the available data) and Abstracts Views on Vision4Press platform.
Data correspond to usage on the plateform after 2015. The current usage metrics is available 48-96 hours after online publication and is updated daily on week days.
Initial download of the metrics may take a while.