Fig. 7
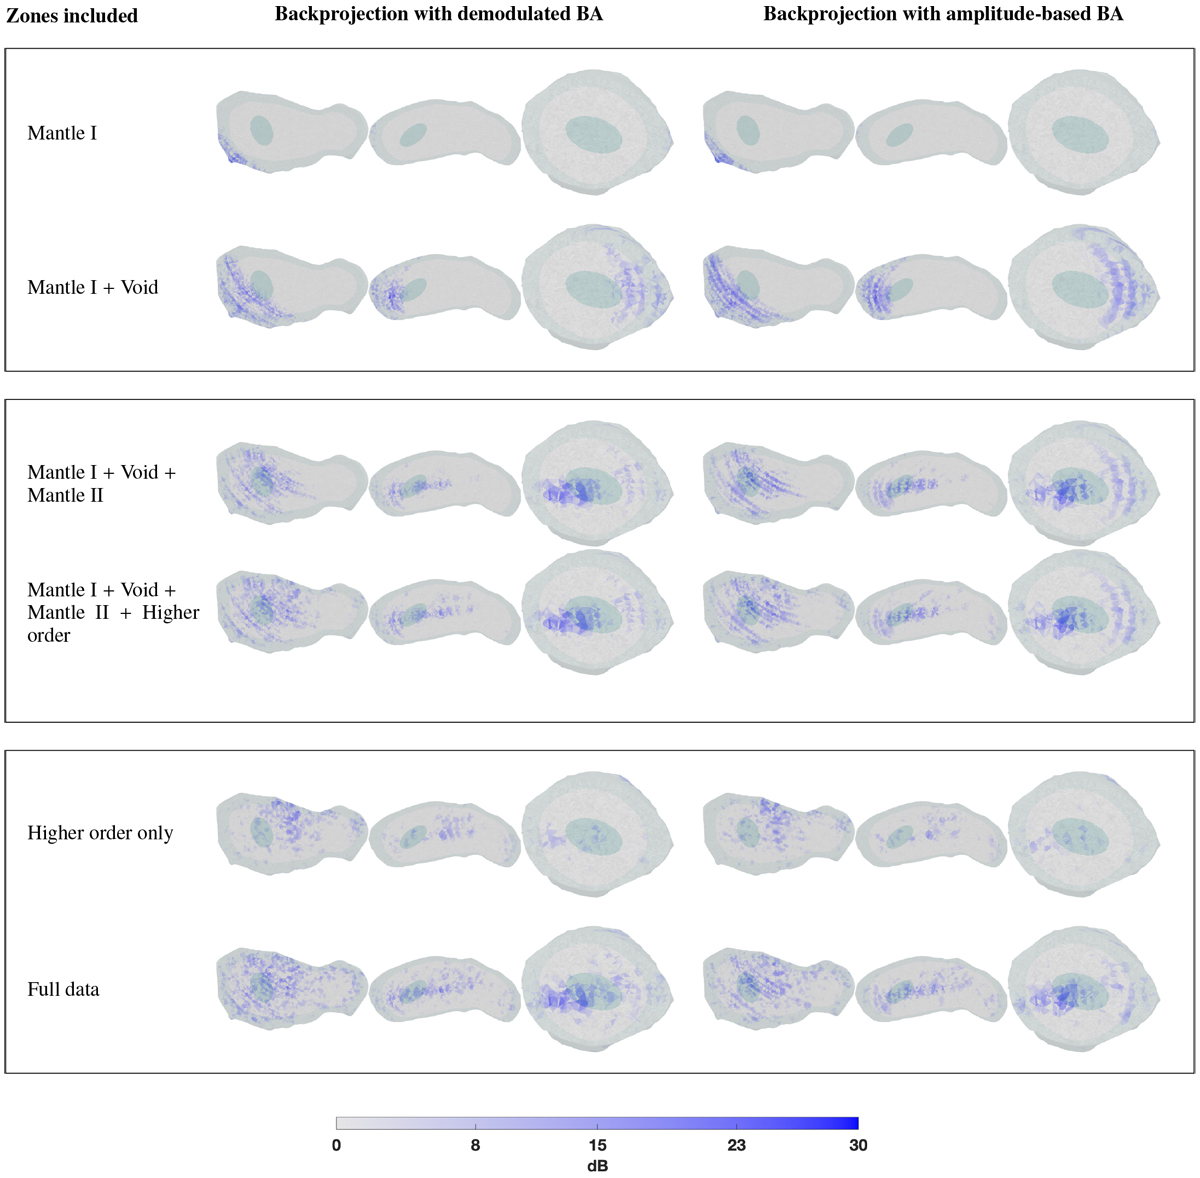
Tomographic backprojection (adjoint operation of BA) obtained with the simulated data with the signal path shown in Fig. 1. Reconstructions are shown in blue for both the demodulated BA (left) and the amplitude-based BA (right) and for the temporal ranges of data as specified by zones in Table 2. The exact DM model structure with the surface layer and the void is shown in the reconstruction background.
Current usage metrics show cumulative count of Article Views (full-text article views including HTML views, PDF and ePub downloads, according to the available data) and Abstracts Views on Vision4Press platform.
Data correspond to usage on the plateform after 2015. The current usage metrics is available 48-96 hours after online publication and is updated daily on week days.
Initial download of the metrics may take a while.