Fig. 6
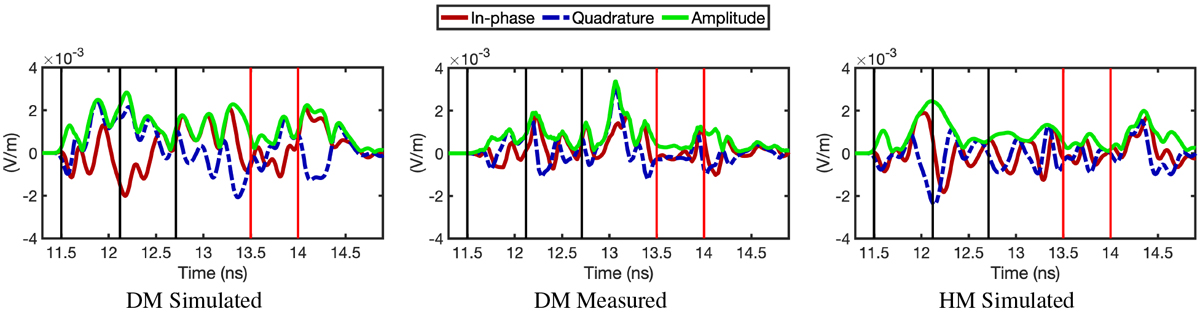
Time domain data obtained via QAM. Two left columns: demodulated in-phase (solid red), quadrature component (dashed blue), and amplitude (solid light green) obtained for the DM analogue via simulation and measurement, respectively.Right column: simulated data obtained for HM analogue. The vertical lines illustrate the temporal zones of Table 2. The red vertical lines indicate the higher order scattering zone.
Current usage metrics show cumulative count of Article Views (full-text article views including HTML views, PDF and ePub downloads, according to the available data) and Abstracts Views on Vision4Press platform.
Data correspond to usage on the plateform after 2015. The current usage metrics is available 48-96 hours after online publication and is updated daily on week days.
Initial download of the metrics may take a while.