Fig. 5
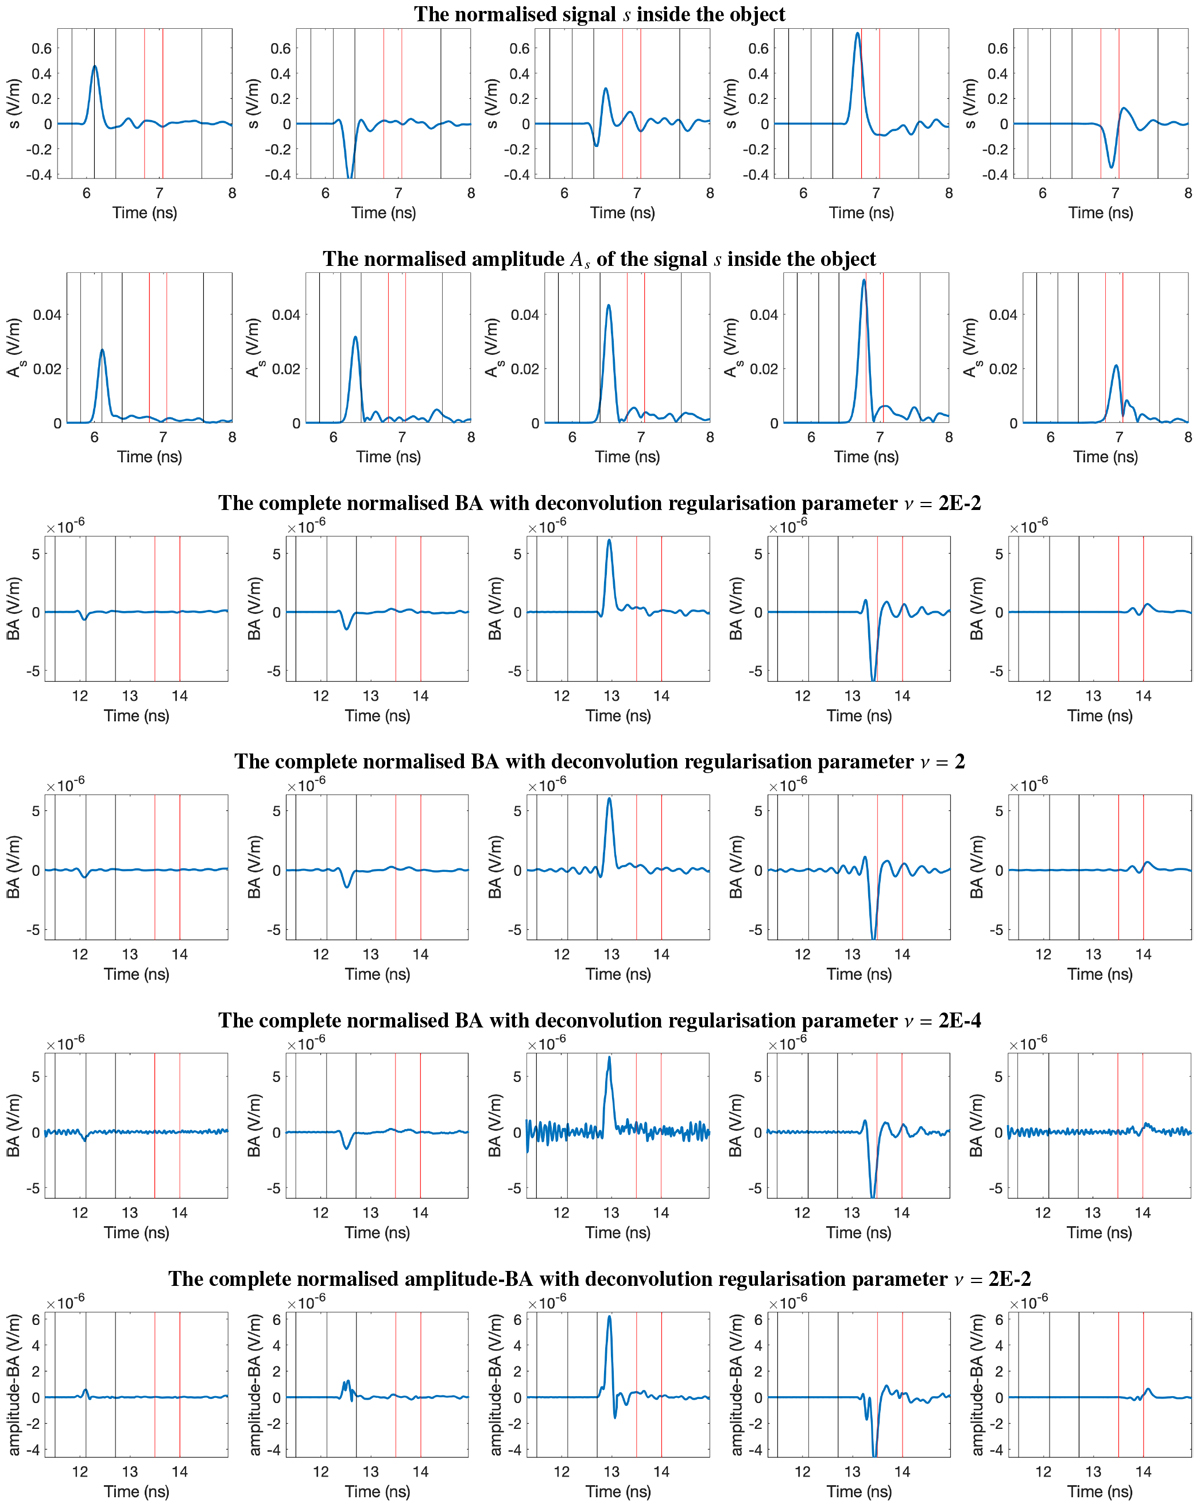
Full temporal wave analysed for the five different locations p1–p5 as indicated by circled dots in the top row of Fig. 4. These locations correspond to the spatial maximiser of the BA for the time points t1 –t5, respectively. The vertical lines show the zone interfaces in Table 2 with the red lines outlining the higher order zone. The two top rows show the BA and its amplitude at the fixed point along the time domain as it propagates through the object. The four bottom rows show the BA at these time points. The row ordering follows that of Fig. 4 and clearly illustrates the effect of the Tikhonov regularisation parameter ν on the deconvolution. The data in each plot have been normalised spatially with respect to the transmitter distance.
Current usage metrics show cumulative count of Article Views (full-text article views including HTML views, PDF and ePub downloads, according to the available data) and Abstracts Views on Vision4Press platform.
Data correspond to usage on the plateform after 2015. The current usage metrics is available 48-96 hours after online publication and is updated daily on week days.
Initial download of the metrics may take a while.