Fig. 4
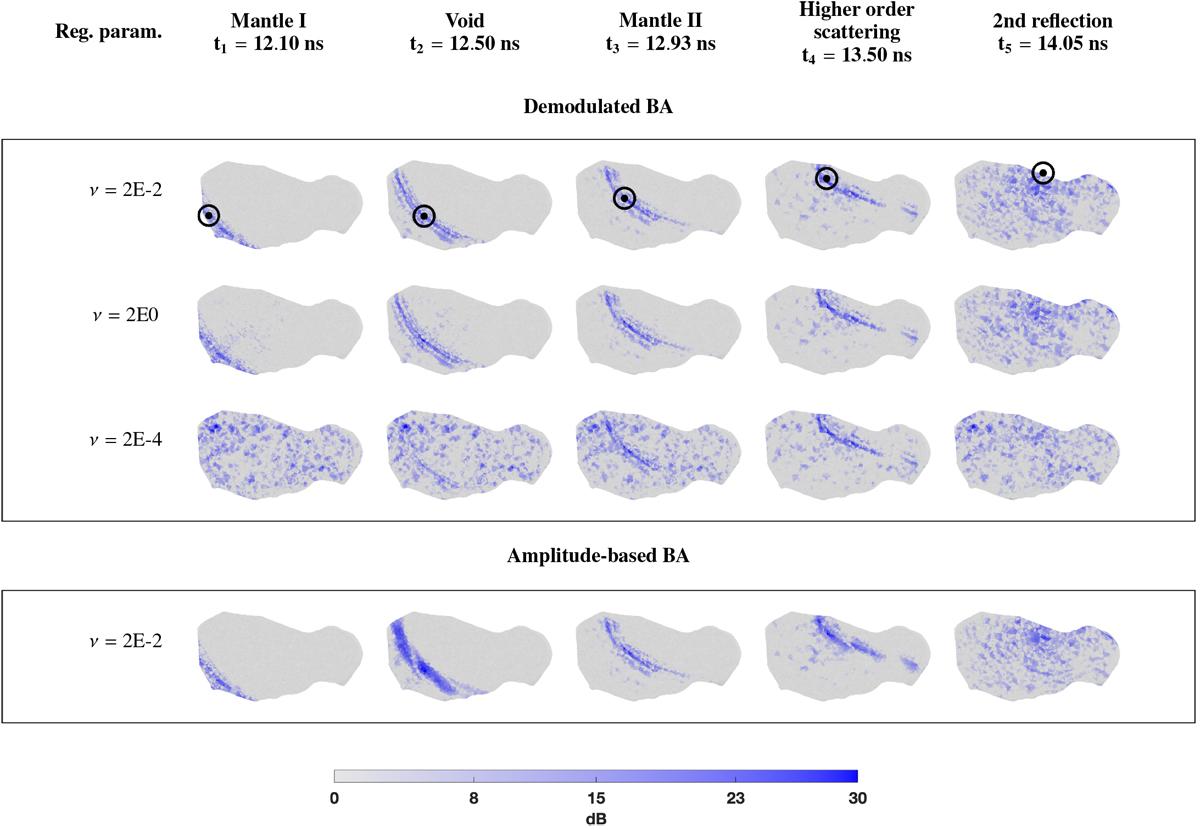
Effect of the deconvolution regularisation parameter on the volume-normalised BA of the QAM signal “Demodulated BA”, d in Eq. (15), and the BA of the amplitude-based signal “Amplitude-based BA”, ![]() in Eq. (16), at five different time points t1–t5 showing the propagation of the wave through the object body. The circled dot in the top row figures indicates the maximum absolute value of the wavefield at the time point and these are the maximiser points for which time-domain data curves are shown in Fig. 5. The close-to-optimal regularisation parameter ν = 2E-2 is shown for the both BAs. The overregularised (reg. param. ν = 2E0) and theunderregularised (reg. param. ν = 2E-4) are shown for the demodulated BA.
in Eq. (16), at five different time points t1–t5 showing the propagation of the wave through the object body. The circled dot in the top row figures indicates the maximum absolute value of the wavefield at the time point and these are the maximiser points for which time-domain data curves are shown in Fig. 5. The close-to-optimal regularisation parameter ν = 2E-2 is shown for the both BAs. The overregularised (reg. param. ν = 2E0) and theunderregularised (reg. param. ν = 2E-4) are shown for the demodulated BA.
Current usage metrics show cumulative count of Article Views (full-text article views including HTML views, PDF and ePub downloads, according to the available data) and Abstracts Views on Vision4Press platform.
Data correspond to usage on the plateform after 2015. The current usage metrics is available 48-96 hours after online publication and is updated daily on week days.
Initial download of the metrics may take a while.