Open Access
Fig. 10
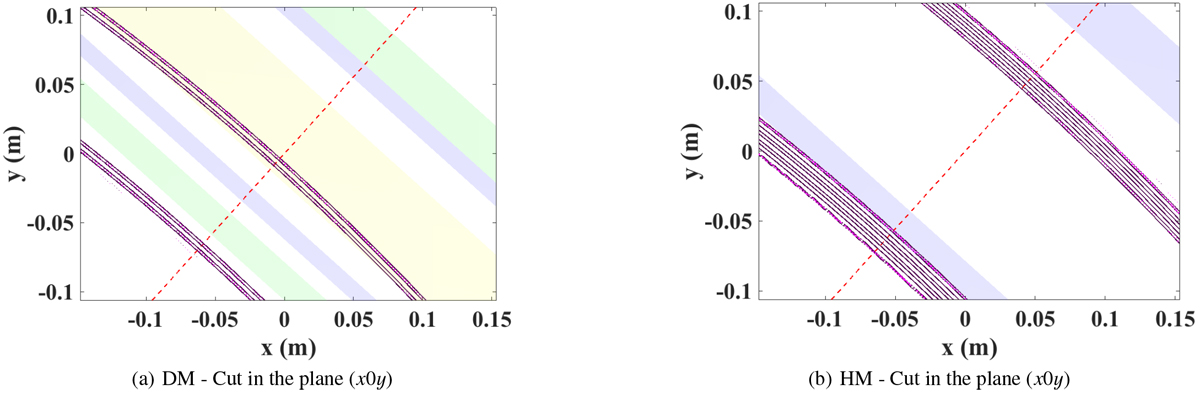
Reconstructions obtained by backpropagation in the frequency domain using the measured fields with a single transmitter and a single receiver and the frequency band between 4 and 18 GHz. The direction of wave propagation of the wave is plotted as a dashed line. The coloured areas are as in Fig. 9.
Current usage metrics show cumulative count of Article Views (full-text article views including HTML views, PDF and ePub downloads, according to the available data) and Abstracts Views on Vision4Press platform.
Data correspond to usage on the plateform after 2015. The current usage metrics is available 48-96 hours after online publication and is updated daily on week days.
Initial download of the metrics may take a while.