Fig. 4.
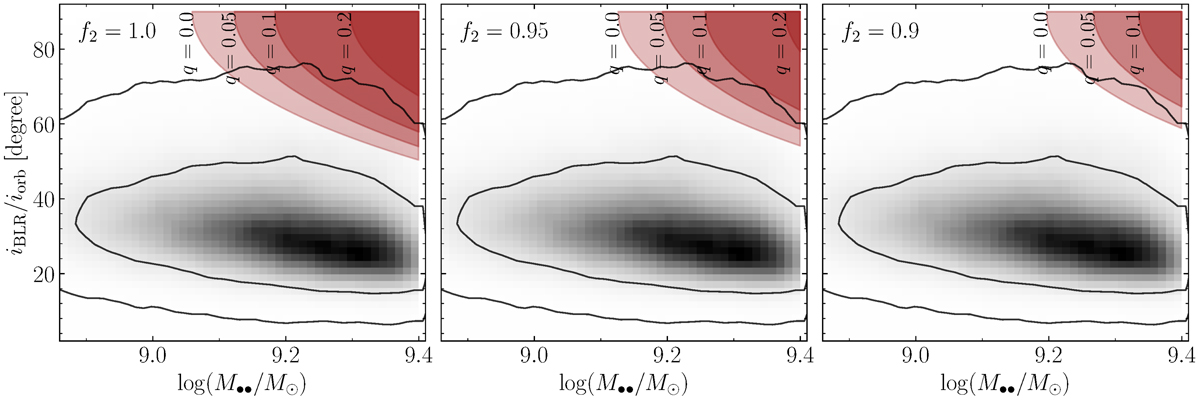
Posterior PDFs for the total mass of BBH (M••) as a function of iBLR (black) and iorb (red). Panels show different luminosity fractions of the secondary BH with f2 = 100% (left), 95% (middle), and 90% (right) assumed in the Doppler boosting hypothesis (D’Orazio et al. 2015). In each panel, the black shaded region with the 68.3% and 95.4% confidence levels overlapped by black solid lines show the PDF result (p(iBLR, M••)) obtained from stacking the PDFs of the Lyα+N V, C IV, and C III]broad emission lines with S/N > 3. As a comparison, the top right shaded region correspond to mass ratios q = 0.0, 0.05, 0.1, and 0.2 (from pink to dark red).
Current usage metrics show cumulative count of Article Views (full-text article views including HTML views, PDF and ePub downloads, according to the available data) and Abstracts Views on Vision4Press platform.
Data correspond to usage on the plateform after 2015. The current usage metrics is available 48-96 hours after online publication and is updated daily on week days.
Initial download of the metrics may take a while.