Fig. 2.
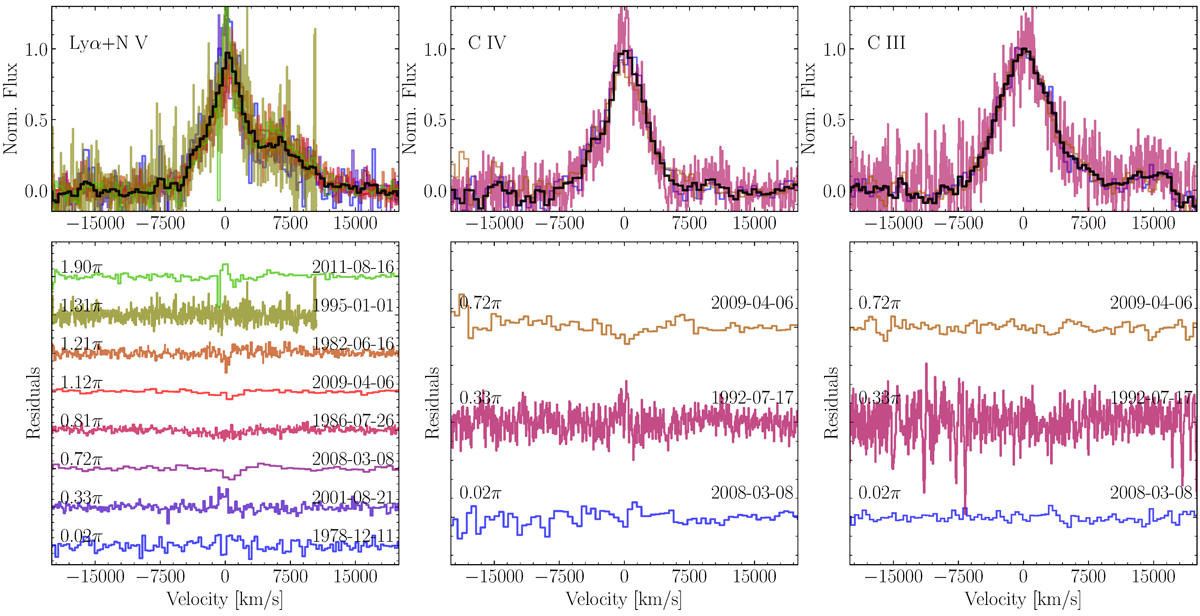
Broad emission line profiles of PG1302-102 derived from IUE, GALEX, and HST observations. Columns from left to right: Lyα+N V, C IV, and C III]broad lines. Top panels: all the observed profiles, normalized to the peak flux of mean broad-line spectrum, with the continuum and Fe II lines subtracted, while the bottom panels present the corresponding profile residuals of each broad line with the averaged broad emission line subtracted. For each broad-line profile and residuals, the colors from blue to green correspond to spectra observed from ∼40 years ago to recent years, with the exact observation time and phase indicated above each spectrum (top right and top left, respectively) in the bottom panels.
Current usage metrics show cumulative count of Article Views (full-text article views including HTML views, PDF and ePub downloads, according to the available data) and Abstracts Views on Vision4Press platform.
Data correspond to usage on the plateform after 2015. The current usage metrics is available 48-96 hours after online publication and is updated daily on week days.
Initial download of the metrics may take a while.