Fig. 1.
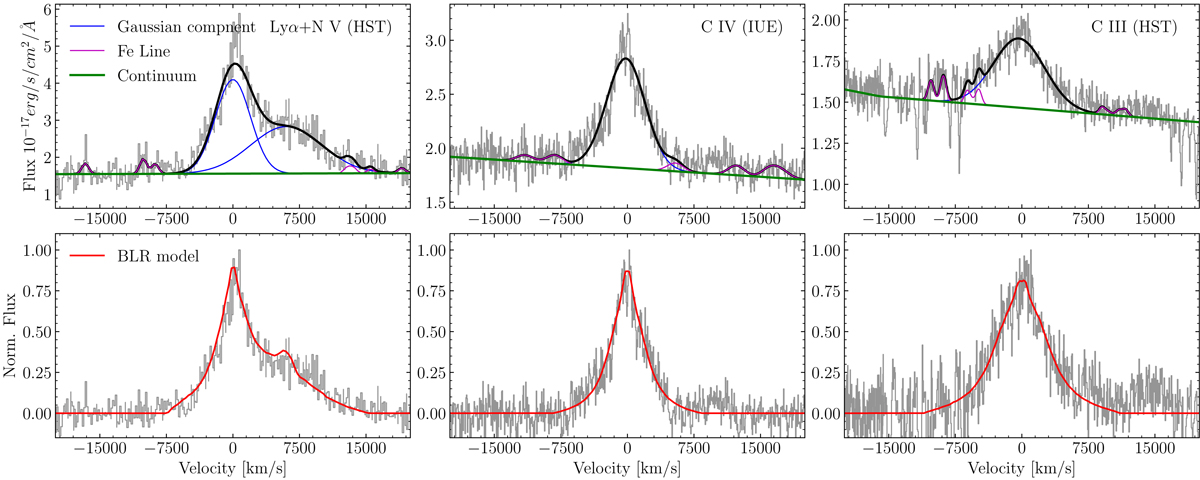
Examples of the spectral decomposition (top panels) and the model fitting (bottom panels) to the broad emission lines Lyα+N V (left), C IV (middle), and C III](right). Top panels: observed spectra (gray curves) are fitted by three components, i.e., a power law continuum (green), a Gaussian broad-line component (blue, for Lyα+N V we use two broad Gaussian components, with the separation of the two line peaks fixed at 6000 km s−1), and multiple lines from the Sigut et al. (2004) Fe II templates (magenta). Bottom panels: gray curves show the broad-line profiles with the continuum and Fe II lines subtracted. The red lines represent the best BLR model fitting results as introduced in Sect. 2.2.
Current usage metrics show cumulative count of Article Views (full-text article views including HTML views, PDF and ePub downloads, according to the available data) and Abstracts Views on Vision4Press platform.
Data correspond to usage on the plateform after 2015. The current usage metrics is available 48-96 hours after online publication and is updated daily on week days.
Initial download of the metrics may take a while.