Free Access
Fig. 9.
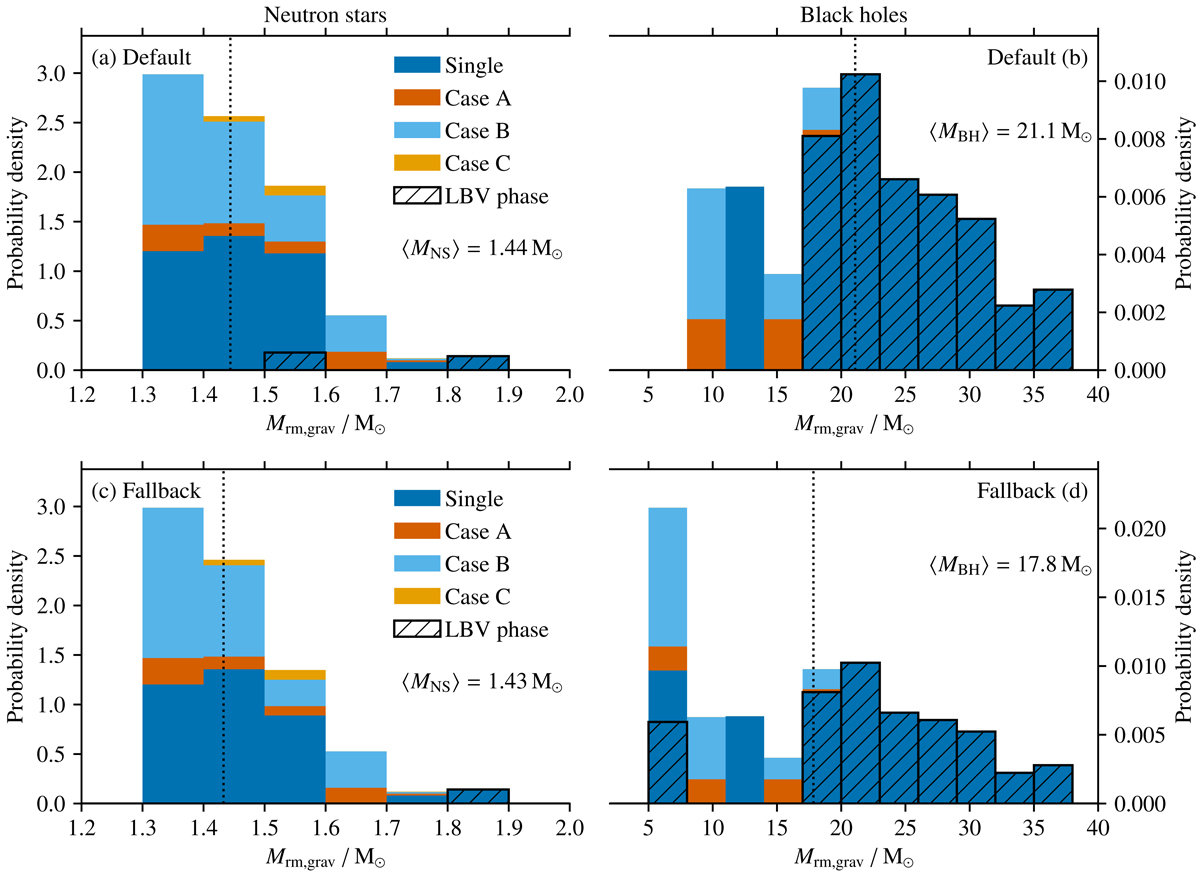
Mass functions of NSs and BHs in our default model (top panel) and a model accounting for fallback (bottom panel). The vertical lines show the median masses of the NS and BH mass distributions, and the corresponding values are provided in the figure. Possible LBV phases are only indicated for the single stars.
Current usage metrics show cumulative count of Article Views (full-text article views including HTML views, PDF and ePub downloads, according to the available data) and Abstracts Views on Vision4Press platform.
Data correspond to usage on the plateform after 2015. The current usage metrics is available 48-96 hours after online publication and is updated daily on week days.
Initial download of the metrics may take a while.