Fig. 4.
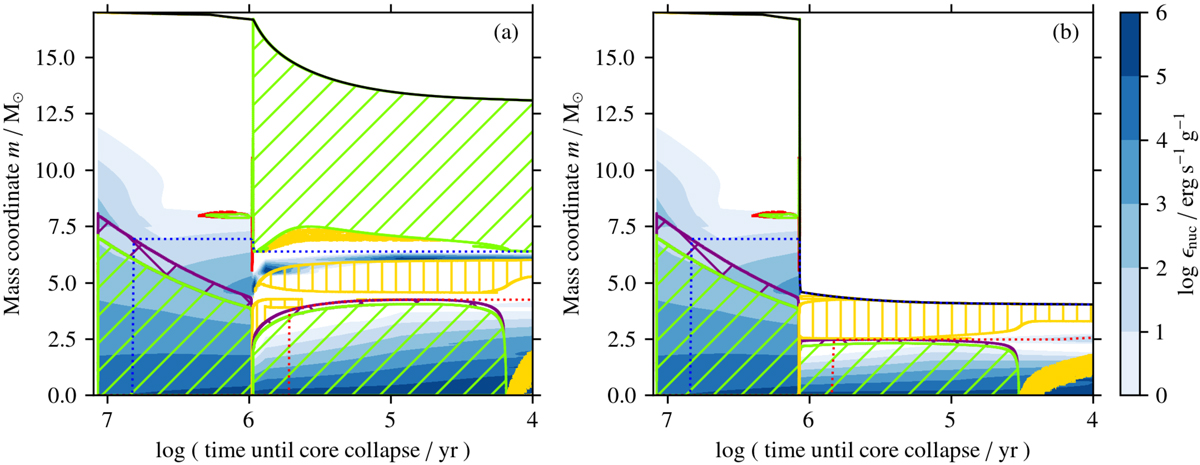
Kippenhahn diagrams of core hydrogen and core helium burning of stars with an initial mass of 17 M⊙. The evolution of a genuine single star (panel a) is contrasted with that of a star that underwent (late) Case B mass transfer (panel b). The blue colour-coding shows energy production by nuclear burning, and the green, yellow, purple, and red hatched regions denote convection, thermohaline mixing, convective overshooting, and semi-convection, respectively. The blue and red dotted lines indicate approximate helium and carbon cores, here defined as the mass coordinate where the helium and carbon mass fractions first exceed 0.5.
Current usage metrics show cumulative count of Article Views (full-text article views including HTML views, PDF and ePub downloads, according to the available data) and Abstracts Views on Vision4Press platform.
Data correspond to usage on the plateform after 2015. The current usage metrics is available 48-96 hours after online publication and is updated daily on week days.
Initial download of the metrics may take a while.