Fig. 2.
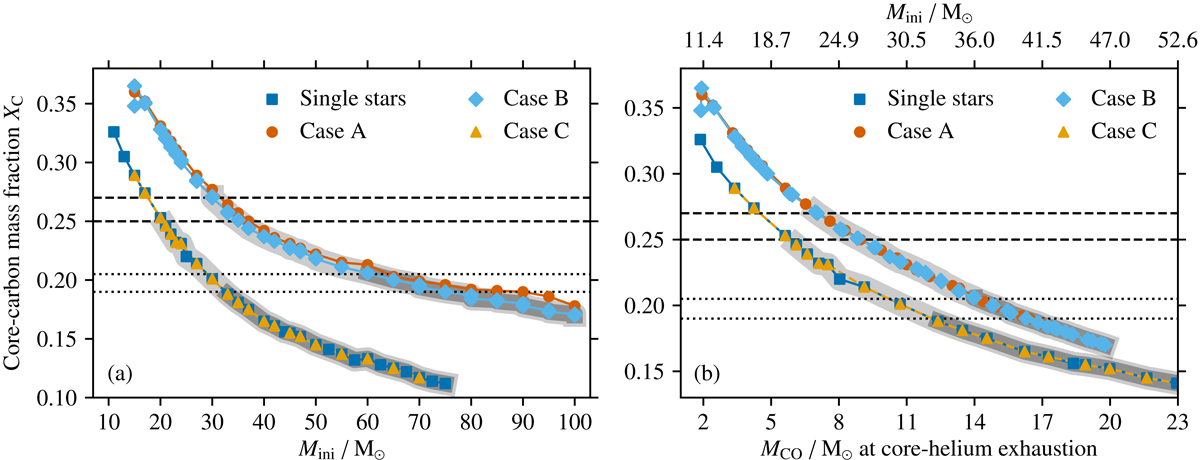
Core carbon mass fraction XC as a function of (a) initial mass Mini and (b) CO core mass MCO at the end of core helium burning. The initial masses Mini of single stars corresponding to MCO are provided at the top of panel b (cf. Fig. 3). The light-grey shading indicates radiative core carbon burning and the darkish-grey shading indicates radiative core neon burning. The dashed (dotted) lines show the core carbon mass fractions at the end of core helium burning below which our models burn carbon (neon) in their cores radiatively. In panel b, we zoom in on the two branches and the ranges in XC and MCO do not correspond directly to those in panel a.
Current usage metrics show cumulative count of Article Views (full-text article views including HTML views, PDF and ePub downloads, according to the available data) and Abstracts Views on Vision4Press platform.
Data correspond to usage on the plateform after 2015. The current usage metrics is available 48-96 hours after online publication and is updated daily on week days.
Initial download of the metrics may take a while.