Fig. 5
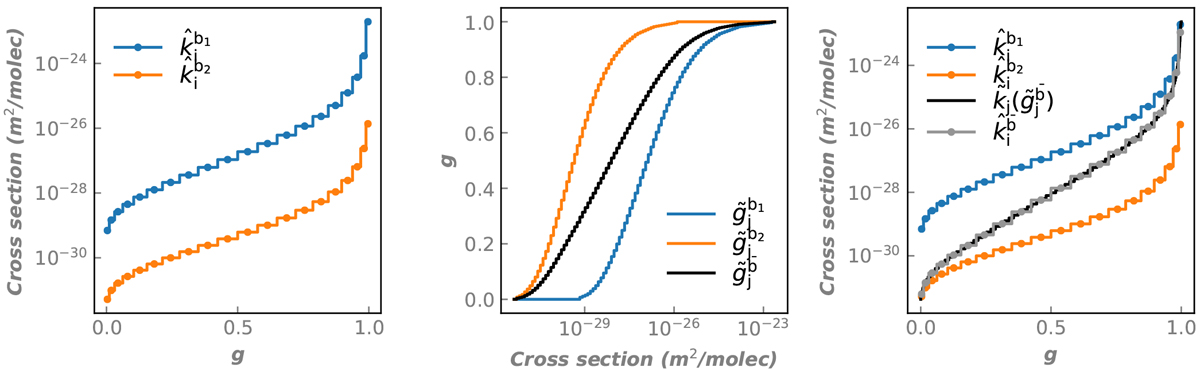
Example of the binning process for two bands. Left: k-coefficients on Ng = 20 Gauss-Legendre quadrature points for two bands (![]() and
and ![]() ).
Middle: g-distribution for the two bands resampled on
).
Middle: g-distribution for the two bands resampled on ![]() , a grid of Nk = 100 points between kmin
and kmax (
, a grid of Nk = 100 points between kmin
and kmax (![]() and
and ![]() ). The black line indicates the weighted sum of these two g-distributions, i.e., the g-distribution of the super-band (
). The black line indicates the weighted sum of these two g-distributions, i.e., the g-distribution of the super-band (![]() ).
Right: colored lines are shown as in the left panel. The black line indicates the finely sampled
k-distribution (
).
Right: colored lines are shown as in the left panel. The black line indicates the finely sampled
k-distribution (![]() ). The gray line represents the k-distribution of the super-band re-sampled on the original g-grid with Ng = 20, i.e., the final k-coefficients (
). The gray line represents the k-distribution of the super-band re-sampled on the original g-grid with Ng = 20, i.e., the final k-coefficients (![]() ).
).
Current usage metrics show cumulative count of Article Views (full-text article views including HTML views, PDF and ePub downloads, according to the available data) and Abstracts Views on Vision4Press platform.
Data correspond to usage on the plateform after 2015. The current usage metrics is available 48-96 hours after online publication and is updated daily on week days.
Initial download of the metrics may take a while.