Fig. 2
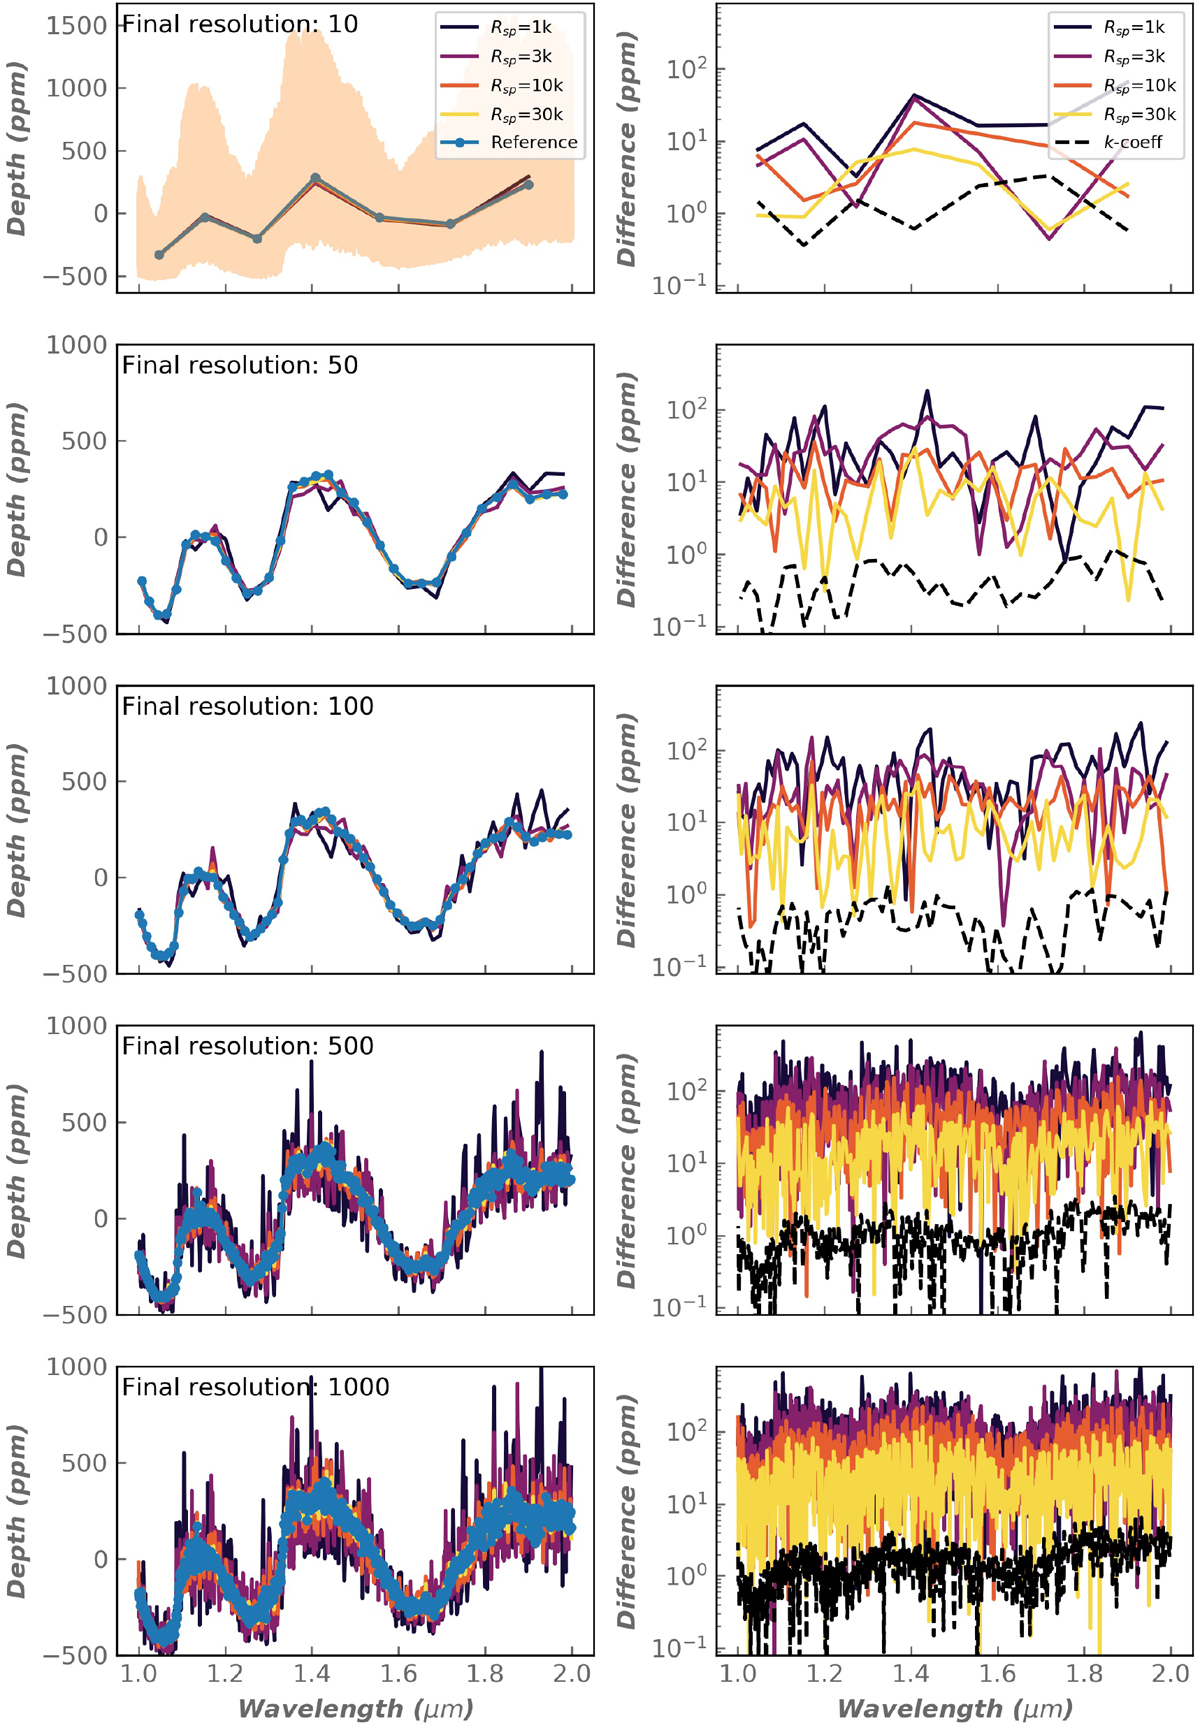
Effect of sampling resolution on the transit spectrum of a hot Jupiter. The various rows show the effect for different final observing resolutions (Rfin, specified in the top left corner of the panels). Left column: transit depth in the 1–2 μm window (with an offset of 11500 ppm). The various colors correspond to the four sampling resolutions (i.e., the resolution used in radiative transfer calculation before binning; Rsp) shown in the legend. The curve with dots shows the reference case computed from our very high-resolution cross sections (Δσ ≈ 0.01 cm−1). The high-resolution reference spectrum before binning is shown as the shading in the top left panel. Right column: difference (in ppm) between the spectra of the left panel and the reference case. The difference between the calculation with k-coefficients and the reference case is shown with the black dashed curve; the two spectra would be indistinguishable in the left panels. The RMS standard deviation over the spectral region is shown in Fig. 1.
Current usage metrics show cumulative count of Article Views (full-text article views including HTML views, PDF and ePub downloads, according to the available data) and Abstracts Views on Vision4Press platform.
Data correspond to usage on the plateform after 2015. The current usage metrics is available 48-96 hours after online publication and is updated daily on week days.
Initial download of the metrics may take a while.