Fig. 1
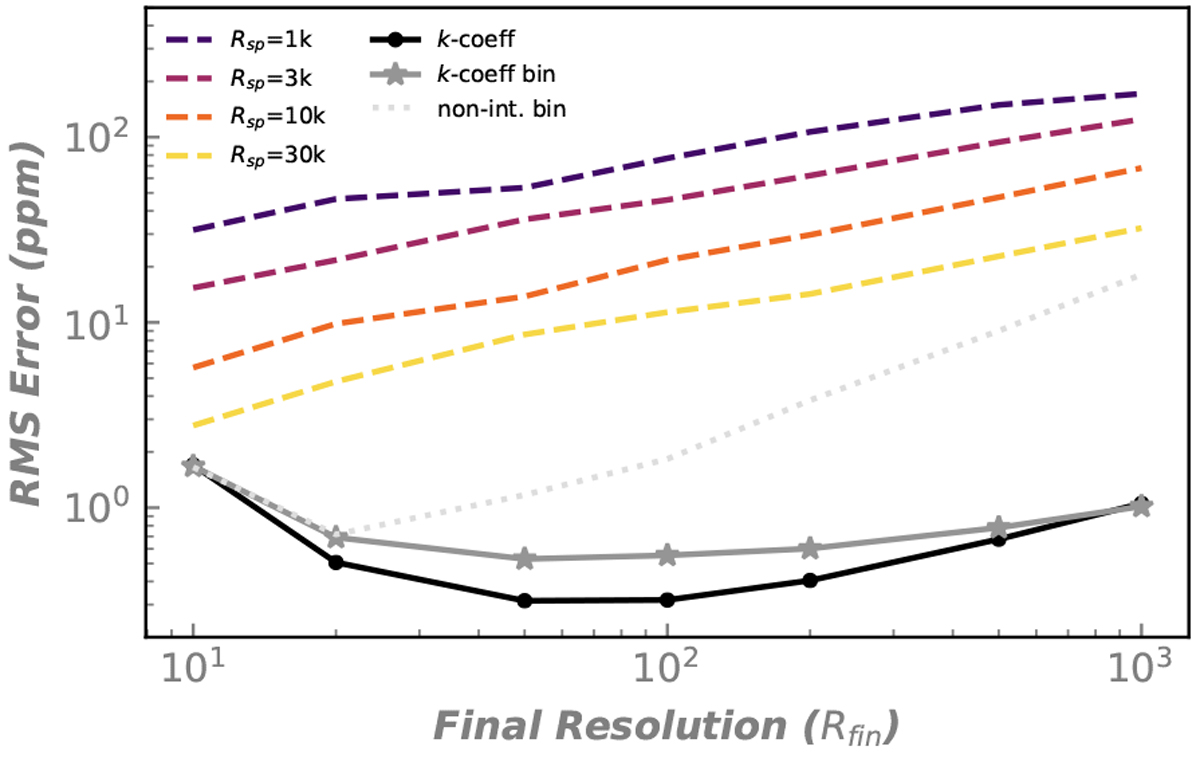
Root mean square error on the transit spectrum of our fiducial hot Jupiter over the 1–2 μm window as a function of the final observed resolution. Dashed curves represent the error obtained with sampled cross-section tables at various sampling resolution (from top to bottom: Rsp = {1000, 3000, 10 000, 30 000}). The spectra are shown in Fig. 2. The black curve with dots represents the error using k-coefficients computed from high-resolution spectra directly at the final resolution. The gray curves show results when using binned down k-coefficients using natural (solid with stars) and non-integer (dotted) binning (see Sect. 3.4 for details).
Current usage metrics show cumulative count of Article Views (full-text article views including HTML views, PDF and ePub downloads, according to the available data) and Abstracts Views on Vision4Press platform.
Data correspond to usage on the plateform after 2015. The current usage metrics is available 48-96 hours after online publication and is updated daily on week days.
Initial download of the metrics may take a while.