Fig. 8.
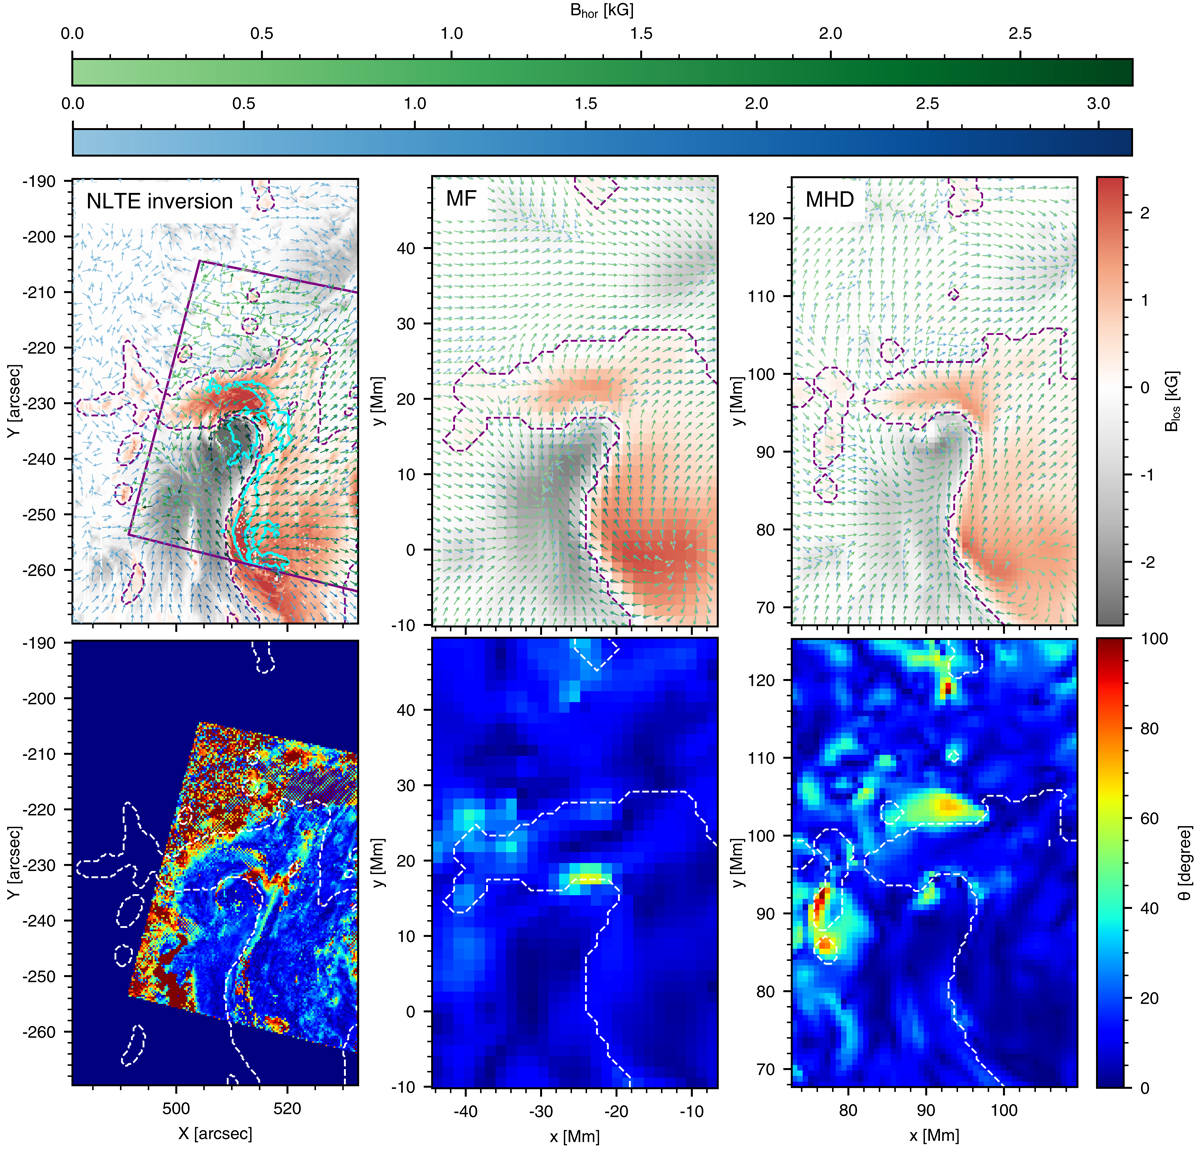
Comparison of the non-LTE-inferred photospheric and chromospheric magnetic field (left column) with those from the magnetofrictional model (middle column) and the MHD model (right column). Top row: photospheric LOS magnetic field with azimuth arrows for the photospheric field (blue) and chromospheric field (green), colour-scaled according to the corresponding colour bars. We encourage using a PDF viewer to appreciate the photosphere-to-chromosphere changes in magnetic field azimuth. The inferred magnetic field has been taken at log τ500 = −1.1 (from non-LTE Fe I) and log τ500 = [ − 2.9, −4.1] (from Ca II 8542 Å) and the magnetic field map in the top left panel is identical to Fig. 5e, only including now also arrows for the chromospheric field azimuth (green). Bottom row: angle θ between the photospheric and chromospheric field vector of the inversions and models. The dashed lines (purple in the top row, white in the bottom row) indicate the photospheric LOS polarity inversion lines, while the cyan contours in the top left panel outline the Ca II flare ribbons.
Current usage metrics show cumulative count of Article Views (full-text article views including HTML views, PDF and ePub downloads, according to the available data) and Abstracts Views on Vision4Press platform.
Data correspond to usage on the plateform after 2015. The current usage metrics is available 48-96 hours after online publication and is updated daily on week days.
Initial download of the metrics may take a while.