Fig. 3.
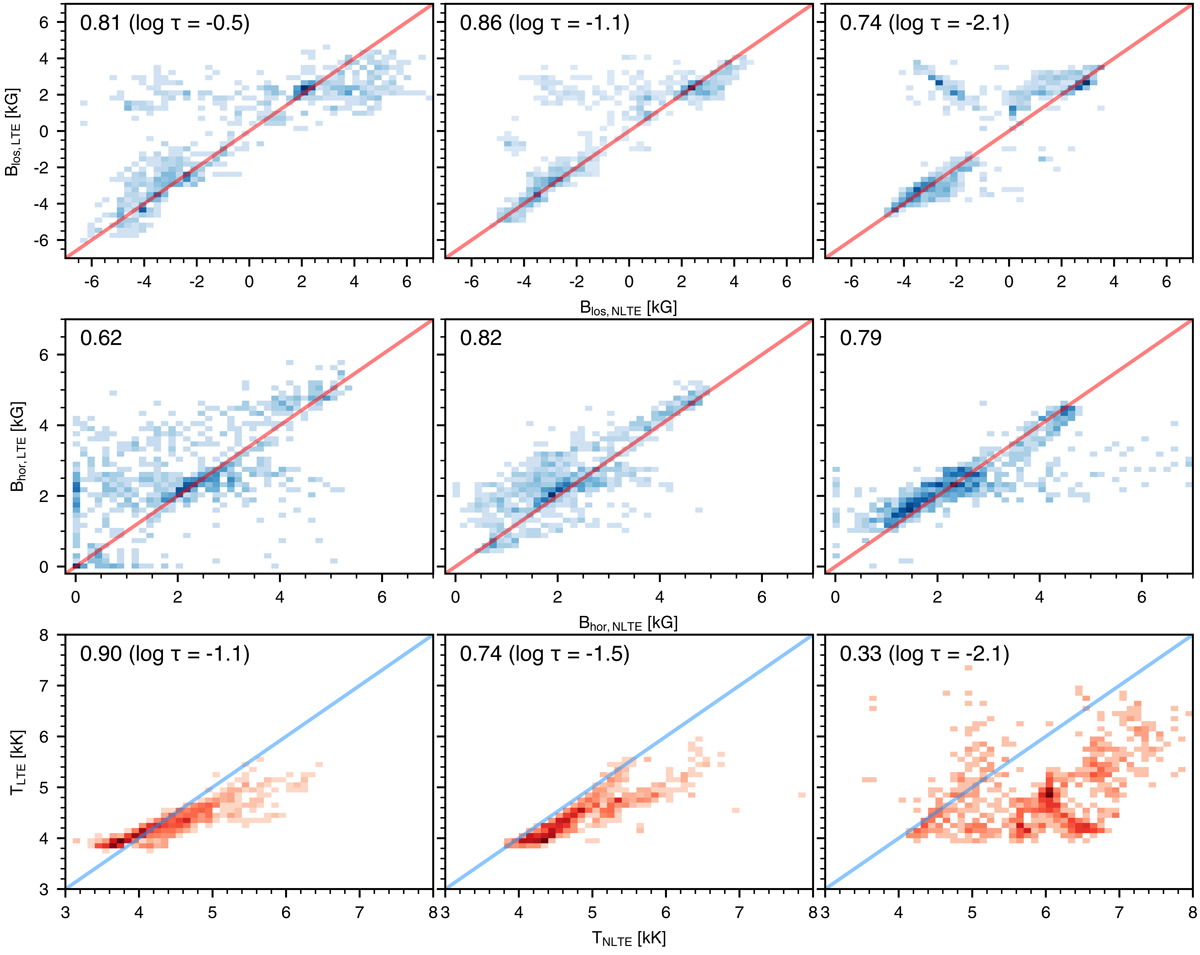
Two-dimensional histograms of non-LTE versus LTE LOS magnetic field strength (top row), horizontal field strength (middle row), and temperature (bottom row) for the flaring pixels (i.e. within cyan contours in Fig. 2) at three log τ500 depths. The Pearson correlation number is shown in the top left of each panel and the log τ500 depth within parenthesis in the top row panels (for magnetic field) and bottom row panels (for temperature), while the straight lines indicate what would be linear relationship.
Current usage metrics show cumulative count of Article Views (full-text article views including HTML views, PDF and ePub downloads, according to the available data) and Abstracts Views on Vision4Press platform.
Data correspond to usage on the plateform after 2015. The current usage metrics is available 48-96 hours after online publication and is updated daily on week days.
Initial download of the metrics may take a while.