Fig. 1.
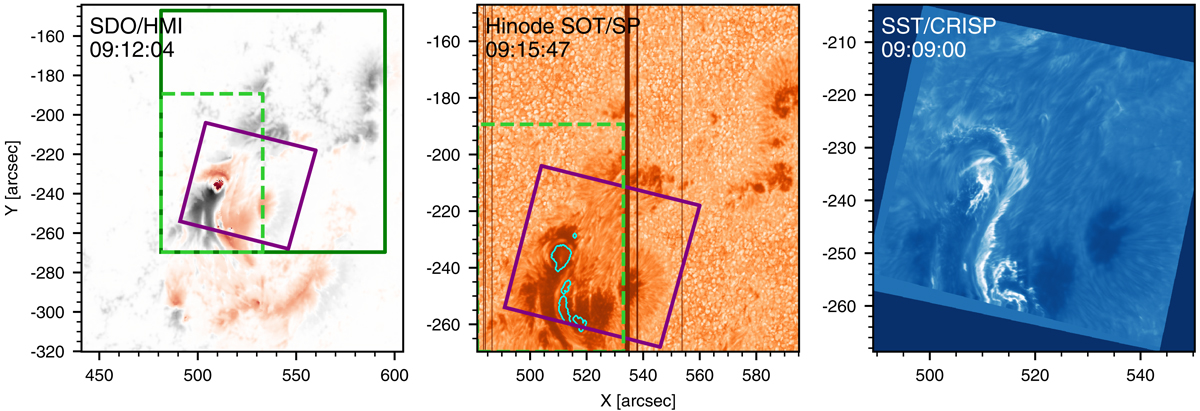
Overview of the analysed data, showing the SDO/HMI-derived SHARP LOS magnetic field from Fe I 6173 Å (left), Hinode/SP continuum near Fe I 6302 Å (middle) and SST/CRISP Ca II 8542 Å red wing at +0.5 Å (right). The Hinode and SST fields of view are indicated in the first two panels with green and purple boxes, respectively, while the dashed light green box in the first two panels outlines the cut-out of Fig. 2. The cyan contours in the middle panel indicate locations where the Fe I lines are in emission. Times in UT are indicated in the top left of each panel (for Hinode SOT/SP the time corresponds to the middle of the slit raster-scan). The vertical stripes in the middle panel are due to missing data.
Current usage metrics show cumulative count of Article Views (full-text article views including HTML views, PDF and ePub downloads, according to the available data) and Abstracts Views on Vision4Press platform.
Data correspond to usage on the plateform after 2015. The current usage metrics is available 48-96 hours after online publication and is updated daily on week days.
Initial download of the metrics may take a while.